EMAIL SUPPORT
dclessons@dclessons.comLOCATION
USFaults & Health Score
APIC in ACI Fabric not only used to provision the ACI and in Policy Orchestration, but it is also provides telemetry data and provides faults , events , statistics reported by fabric switches , Virtual Switches and integrated L4-L7 Devices.
ACI uses MIT (Management Information Tree) to represent faults, events and statistics as managed object of class faultInst or faultDelegate and all these types of Managed Objects can be queried to get valuable data.
In ACI each fault is assigned an alphanumeric string in form of FXXX which is used to uniquely identify each faults.
System faults in ACI list all faults related to ACI fabric and these faults MO is automatically created, escalated, de-escalated and deleted by system as specific conditions are detected. If same conditions are raised for multiple times, only one fault related to that particular event will be created and a counter for the recurrences of that faults is incremented.
In ACI Faults are triggered or generated based on rules, counters, crossing thresholds, task/state failure etc.
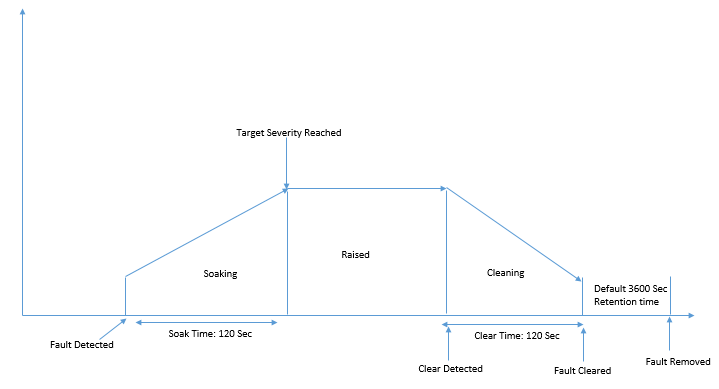
Below are some Life cycle process of faults in ACI, let’s understand that.
- When any events happens and rules is matched, system detect faults and adds the Faults object in ACI MIT tree.
- After soaking time (120 Sec) expires, and target severity is reached, faults transitions to raised state. Here faults are retained, until error is resolved either by Network admin or it’s automatically resolved by System.
- Once error is resolved, system keeps the faults in cleaning state up to 120 sec (default 120 sec cleaning state timer).
- When cleaning timer expires, system clears the faults. But still keeps this fault until retention timer expires which is 3600 Secs.
- Once all these timers expires, finally faults will be removed from system.
For soaking and clearing, these timers discussed are configurable between 0 to 3600 Seconds. Retention timers are configurable between 0 to 31536000 seconds.
As we discussed, that each faults are mapped with some severity, below are some severity levels defined in ACI
- Warning
- Minor
- Major
- Critical
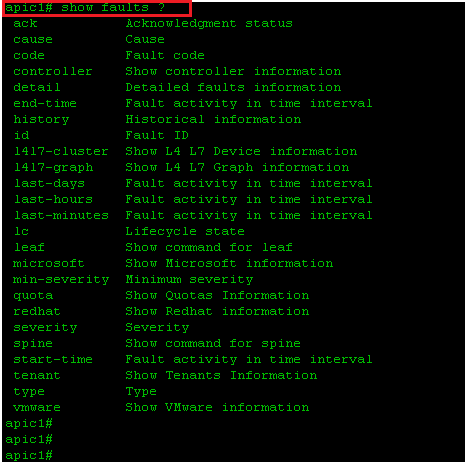
Below are some faults commands used in ACI on NX-OS
Health Score in ACI
ACI collects the network data and then correlates it, analyze it and provides a health score based on it on real time basis.
Range of health score is between 0 % to 100%. In ideal situation, health score of a healthy and well function ACI fabric score should be 100%. These Health score can be easily found and seen on ACI GUI.
Fabric Health in APIC can be seen as System | Dashboard, here you can see health score of all system Hardware, Tenants, Objects in ACI.
When a health score of any objects is reduced by system, its related fault are generated. All Health scores are instantiated from healthInst class in MIT and can be extracted via REST API.
System health scores are calculated based on average weighted health score of all leafs, Spines and Endpoints in fabric. Tenant health score are calculated based on health component of all logical component of that particular Tenant.
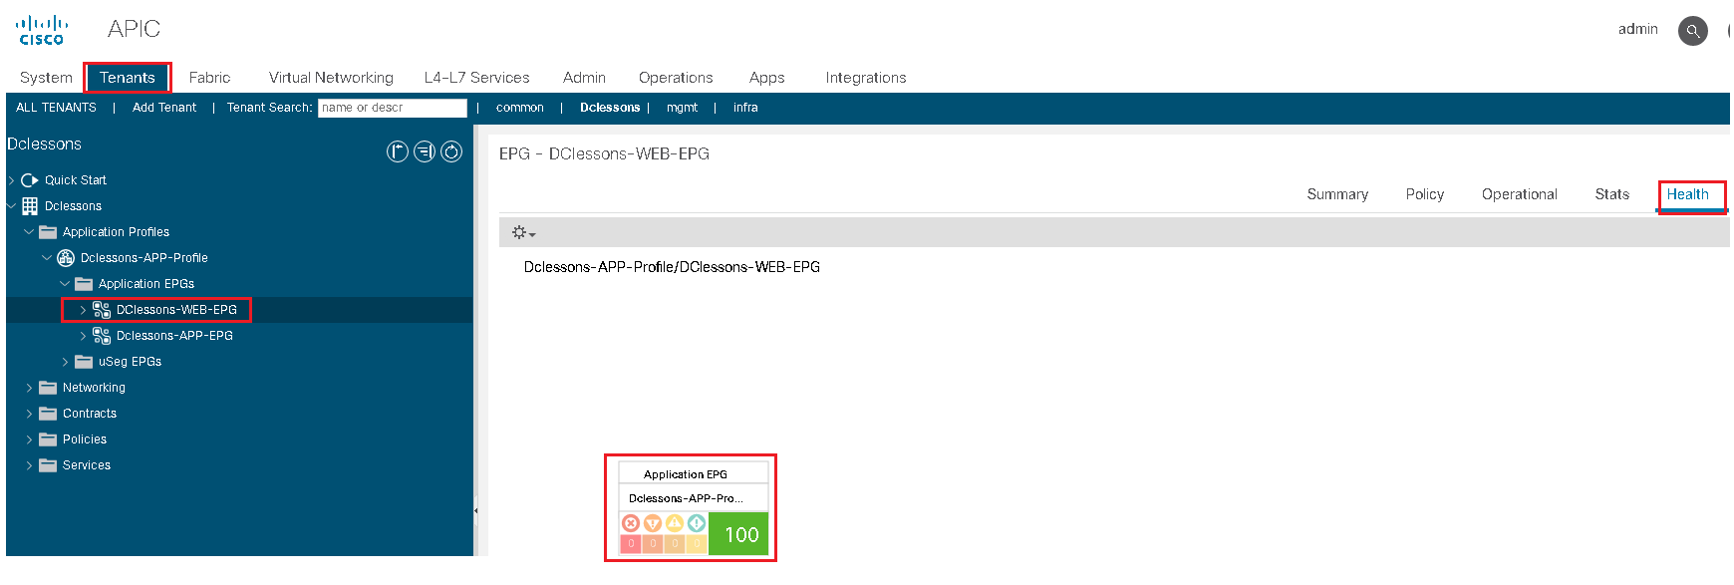
If you want to see the health score of an object, go to Tenants | Application Profile | EPG, on right side of work pane, click on health tab as shown in below figure.
Below are some commands used in CLI mode?
To view the health of a tenant
apic1# show health tenant tenant-name
To view the health of a bridge domain within a tenant
apic1# show health tenant tenant-name bridge domain bd-name
To view the health of a leaf
apic1# show health leaf node-ID
Also, you can query health scores through the REST API. The following example is a REST query to the fabric that returns the health score for a tenant named DCLESSONS
GET: https://apic-hostname-or-IP/api/node/mo/uni/tn-DCLESSSONS.json?query-target=self&rsp-subtree-include=health.
There are some ACI internal protocol like SNMP, Syslog, Net flow which are used for ACI Internal Monitoring.
SNAMP
SNMP is Simple Network Management Protocol used to Manage and Monitor Network Devices. When SNAMP query to some Network Device,its will be using UDP port 161 and when some events occurs on Network Device , SNMP pushes some data towards NMS by using UDP port 162 and this operation is known as Trap.

Comment
TABLE OF CONTENTS
- ACI Initial Fabric Configuration
- ACI Configure Tenant VRF & Bridge Domain
- ACI Configure Filters and Contracts
- ACI Configure Three-Tier Application Profile
- ACI Configure Baseline Interface Policies
- ACI Integration with VMWARE
- ACI Inter Tenant Connectivity
- ACI Extend Bridge Domain by External Layer 2 Connection
- ACI External Network Connectivity to External Switch via Trunk
- ACI Static Routing for External Layer 3 Connectivity
- ACI OSPF Routing for External Layer 3 Connectivity
- ACI EIGRP Routing for External Layer 3 Connectivity
- ACI EBGP Routing for External Layer 3 Connectivity
- IPN Configuration
- ACI Multipod Overview
- ACI Multi-Pod Building Control Plane
- ACI Multi-Pod Data Traffic Flow
- Multi-Pod Connectivity via External L3
- Host Tracking Subnet Check & Limit IP Learning
- Service Graph Introduction
- BD VRF & EPG Design consideration – Service Chaining
- IP Routing & VRF Design Consideration – Service Chaining
- L3Out for Routing to L4-L7 Devices
- Routed Mode ( Go-To mode ) for L4-L7 Appliance
- Transparent & One ARM mode for L4-L7 Appliance
- Policy Based Redirect in ACI
RECENT POSTS
- Installing Context-Aware Network Access Control using Cisco ISE Policies
- Designing Network Access Control that is Scalable using Cisco ISE Architecture
- Enterprise Network Access Control and Policy Enforcement using Cisco ISE
- Secure Device Administration and Network Access Using AAA Architecture
- Designing Enterprise-Class Hybrid Cloud Connectivity Using AWS Networking Services
- Exploring Core AWS Networking and Messaging Concepts for Modern Cloud Architectures
- Understanding Key AWS Services for Modern Cloud Architectures
- Building a Strong AWS Foundation with Amazon S3, EC2, and Virtual Private Cloud
- Understanding the ENSDWI Course: Advanced Cisco SD-WAN (Viptela) Concepts
- A Complete Guide to the DCACI-A Course: Mastering Advanced Cisco ACI Concepts


LEAVE A COMMENT
Please login here to comment.