EMAIL SUPPORT
dclessons@dclessons.comLOCATION
USDNA Center Assurance Architecture
DNA center Assurance engine treats everything as sensors and pulls network data from various source, once these data are received, Assurance engine does correlation, analyze the data and provide information according to network operator needs such as issue insights for network device, application and clients.
Using Assurance engine, operator receives 360 view of state of network. DNA Assurance application need to be installed on DNA Center. Below figure shows the DNA center Architecture which has Assurance and Automation applications and have continuous flow of Information
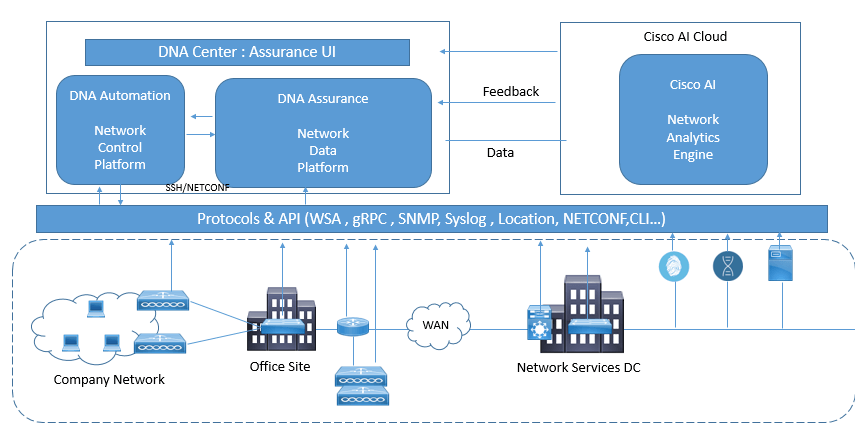
Once Cisco DNA Assurance receives data from customer network devices via protocols such as syslog, streaming telemetry, Net Flow, pxGrid from Cisco ISE, SNMP, DHCP, etc. This data is sent through the correlation engine as well as the Cisco AI Network Analytics engine on the Cisco AI cloud. The correlation and insights are provided to Cisco DNA Assurance in the form of health scores, top issues, and guided remediation. Now once this information is given , the guided remediation or best practices can be implemented on the network through Cisco DNA Automation (also known as the Network Control Platform), which uses secure protocols such as Secure Shell (SSH) and Network Configuration Protocol (NETCONF) to implement the changes on the network devices.
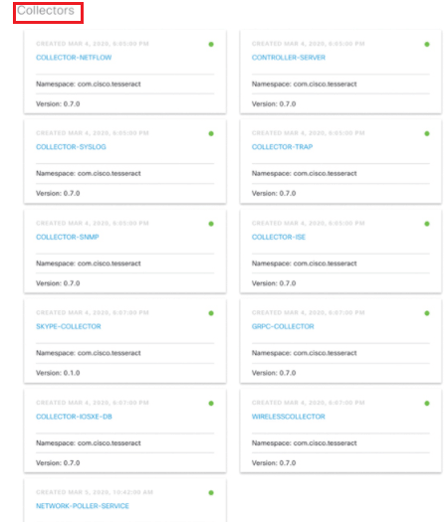
Below figure explains about DNA Assurance Data Collectors
Health Dashboards
DNA center Assurance provides the health scores, which are assigned to network devices, clients, and applications based on several KPIs received from network. Health scores are color coded to reflect the alert level so that network operator can easily see which items needs immediate action.
Below figure explains about health Score range of DNA Center.
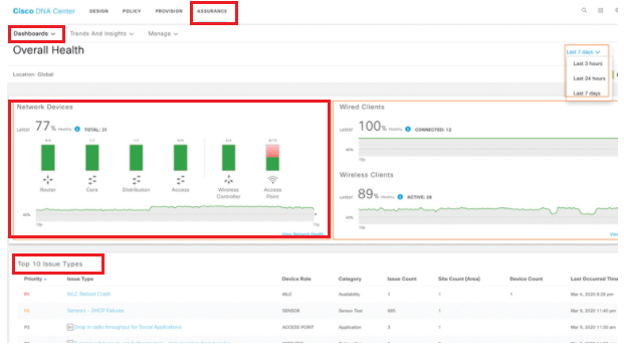
Overall Health Dashboard
Blow is the high level view of DNA center Assurance Overall Health Score dashboard. It provides summery of network health, client health (Wired and Wireless). It also shows Top Tem issue types section for network operator.
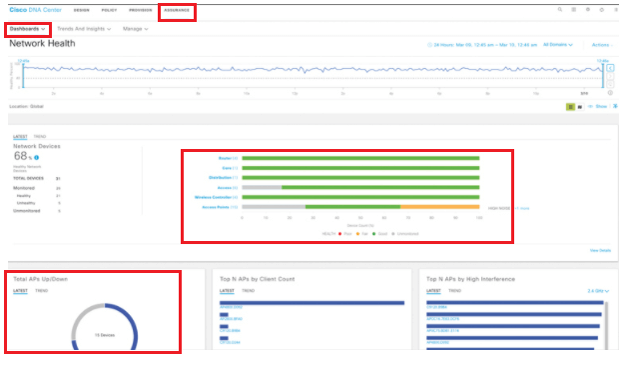
Network Health Dashboard
This dashboard provides overall network Infrastructure health summery. These health score are calculated based on system health ( memory , CPU utilization ) , data plane health ( link errors , link state, signal to noise ratio , Interference ) , control plane health ( reachability to control plane node ).
Below figure explains about DNA Assurance Network health Dashboard.
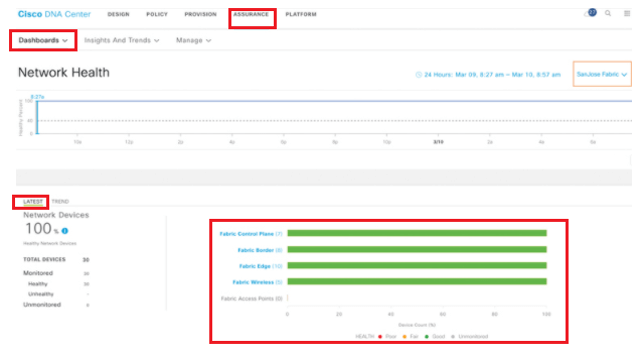
SD-Access Fabric network health
The Cisco DNA Assurance Network Health dashboard offers health state visibility of a Cisco SD-Access fabric site and a domain. The health state of the fabric domain is the aggregation of individual fabric sites. Below figure states a dashlet of the fabric domain named SanJose Fabric. The dashboard provides a summary of the health of the fabric control nodes, border, edges, and fabric wireless controller.
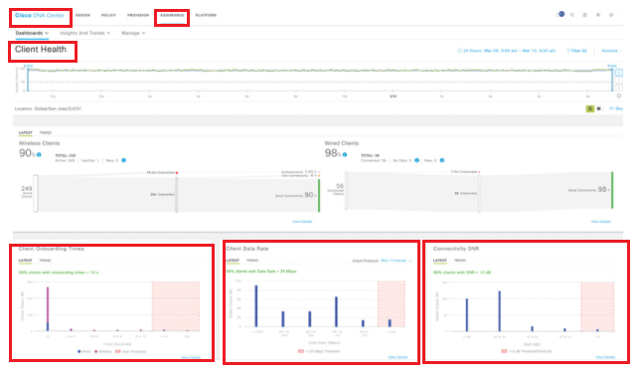
Client Health Dashboard
The Cisco DNA Assurance Client Health dashboard provides a health summary of all the clients. It breaks down the client health scores into categories for wired clients and wireless clients. In below the Client Health dashboard shows several client analytics, such as Client Onboarding Times, Client Data Rate, and Connectivity SNR, and the trends for these various attributes.
Below figure describes the DNA Assurance Device client Health Dashboard.
Comment
TABLE OF CONTENTS
- How to add Site, Floor & Building
- How to Create Wireless Network Profile
- How to Provision a Device to New Site
- How to do ZTP via PnP of New Device
- How to Configure Multi-Site Remote Border
- How to Configure Fabric In Box Configuration
- How to Perform SWIM Action
- How to Configure Device RMA
- How to Create Virtual Network
- How to Create Group Based Access Control Policies
- How to Create Access Contract
- How to work on Policy Analytics
- How to do AI Endpoint Analytics
- Learn Overall Health of Network Devices & Health Score
- Learn how to visualize the Over all health of Wireless Client
- Learn how to Application Analysis via DNA
- How to analyse the Sensors Performance Testing
- Management of Industrial Extended Network
- How to Configure Security for IOT
- How to Create Template for IOT Network
- How to Create Network Profile
RECENT POSTS
- Understanding Cisco ISE Authentication and Authorization Policies
- Installing Context-Aware Network Access Control using Cisco ISE Policies
- Designing Network Access Control that is Scalable using Cisco ISE Architecture
- Enterprise Network Access Control and Policy Enforcement using Cisco ISE
- Secure Device Administration and Network Access Using AAA Architecture
- Designing Enterprise-Class Hybrid Cloud Connectivity Using AWS Networking Services
- Exploring Core AWS Networking and Messaging Concepts for Modern Cloud Architectures
- Understanding Key AWS Services for Modern Cloud Architectures
- Building a Strong AWS Foundation with Amazon S3, EC2, and Virtual Private Cloud
- Understanding the ENSDWI Course: Advanced Cisco SD-WAN (Viptela) Concepts


LEAVE A COMMENT
Please login here to comment.