EMAIL SUPPORT
dclessons@dclessons.comLOCATION
USGCP Cloud Operation Suite
GCP has inbuilt integrated tool called Google Cloud Operations suit formally called as Stack driver. stack driver was founded in 2012 as Software-as-a-service (SaaS) platform, that helps in consistent monitoring across different cloud layers.
In 2014 it was acquired by Google and made publicly available in 2016 as a GCP service.
Currently Google Cloud Operation Suit can monitor both GCP and AWS infrastructure. It is a set of tools that provide following services:
- Monitoring
- Logging
- Debugging
- Tracing
- Error Reporting
- Profiling
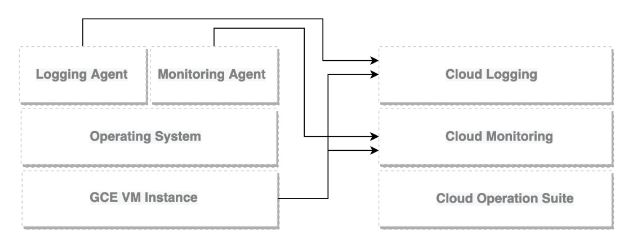
Monitoring and logging services are agentless but if we want to get more information or metrics and logs, an agent must be installed. There are two type of agents that can be installed on your instances:
- Monitoring agent: It is based on collectd software.
- Logging agent: based on fluentd software.
Below figure shows a GCE VM instance and agents that are installed on it. The VM instance by default, talks to logging and Monitoring and agents reports to their respective services.
Google Cloud’s Operations suit allows us to monitor both the infrastructure and applications.
With Google Cloud Operations suite, Enterprise can pay for what they use. The cost can also be controlled by using Cloud Billing reports and alerts.
Below are some Google Cloud Operations suite services can be used for free:
- Cloud Debugger
- Error Reporting
- Cloud Profiler
Below are following services that may incur cost once monthly limits have been executed.
- Cloud Logging
- Cloud Monitoring
- Cloud Trace
How to configure Google Cloud Operation Suit
It is enabled on Project-by-project basis. One of the best practices says that, if you are going to use only one project, then enable it for that project only. But if you have more than one project, you should have a separate project just for monitoring, this is called as scoping project and from this project you will be indicating which other projects an enterprise will monitor.
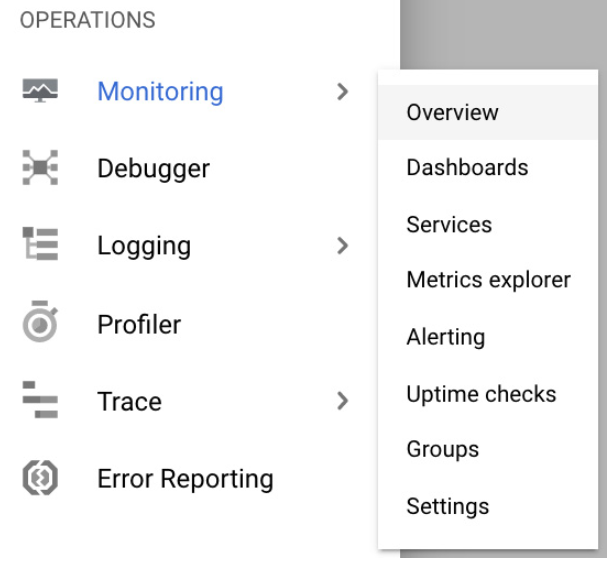
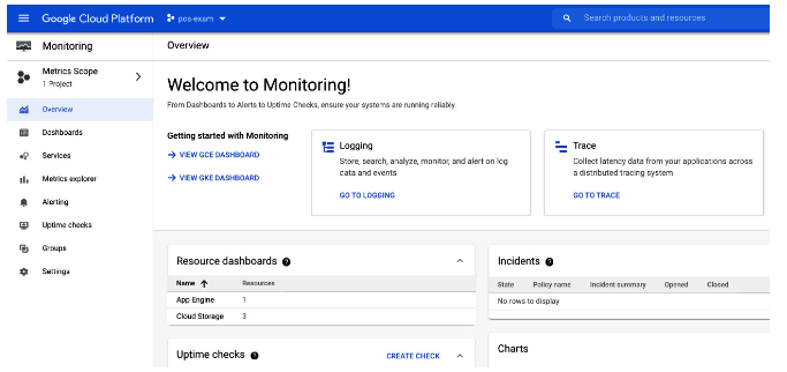
From the main menu, Go to Monitoring and choose Overview:
You will be in Google cloud monitoring main screen. here you will see GCP resource Monitoring such as resource Dashboard, Incident Uptime check ….
If you have multiple projects, enable monitoring for each project by clicking on metrics Scope in the left pane and then on Add Cloud Projects to metrics scope
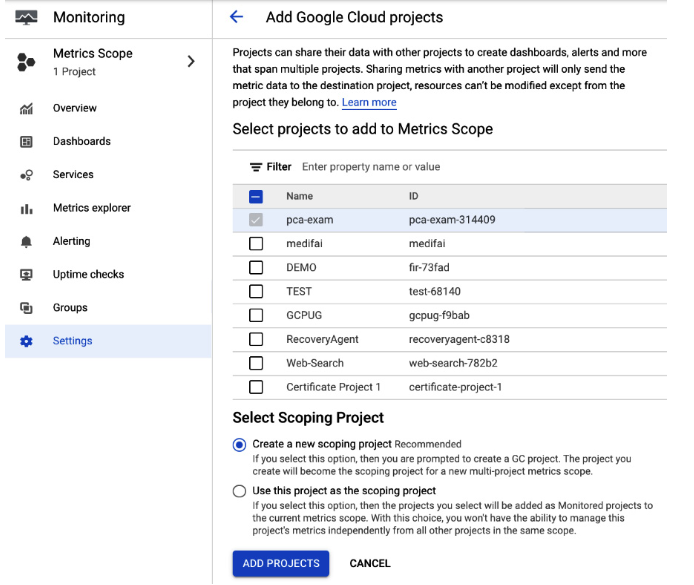
Here you have also option to choose whether you want to monitor AWS resources. If yes, then it will require IAM Role in AWS with listed permission. But if you work only with GCP, then you can launch Monitoring by clicking on Skip AWS Setup.
Cloud Monitoring
With Cloud Monitoring Service, Enterprise can discover and monitor all GCP resources and its services. This Monitoring console allows us to view all of your resources, create alerts policies, and view uptime checks, groups, and custom dashboard.
It also allows us to navigate to debug, trace and error reporting console. Using Cloud Monitoring, we can configure following items:
- Groups
- Dashboards
- Alerting Policies
- Change Screen
- Uptime checks
- Monitoring agents
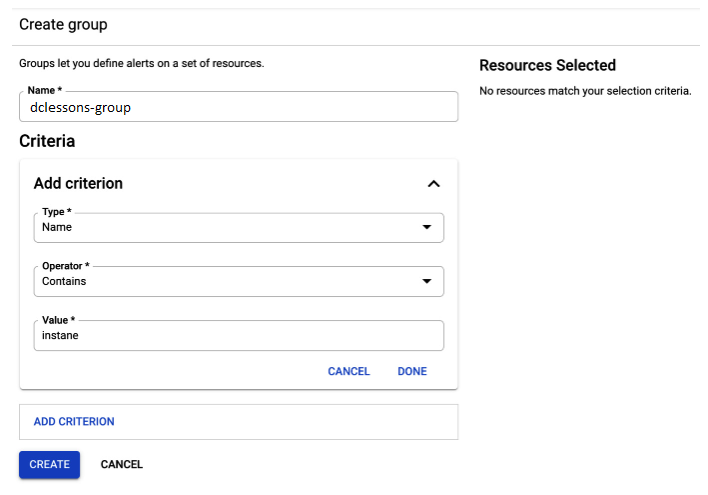
Groups:
Grouping means, resources like VM instances, Applications, databases, can be grouped into logical groups, which helps to manage them together and display them in dashboard.
In order to define criteria to filter resources, Constraints are used. These are based on names, regions, applications etc. The groups can also be nested in one another, and the nesting can be six level deep.
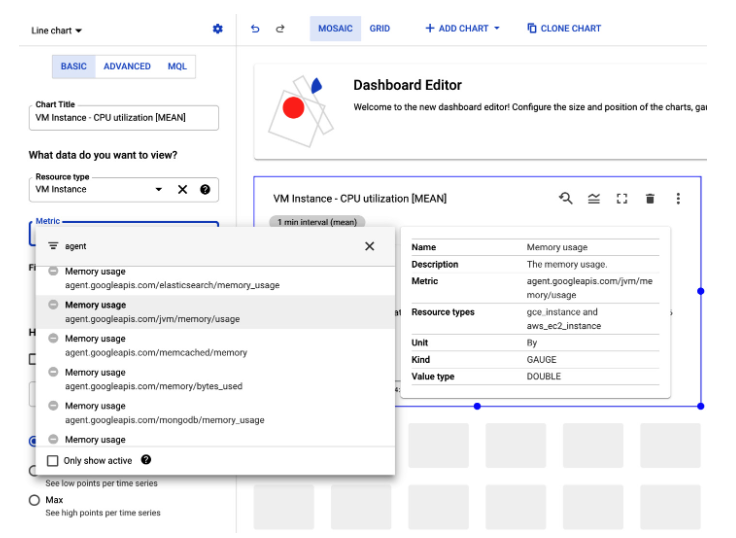
Dashboard:
It provides complete visibility to different metrics in a single plane of glass. Admin can create multiple dashboards that contain charts based on pre-defined or user-defined metrices.
This allows us to create customized boards with most important metrics.
For VM instance, we can also see agent based metrices on top of standard metrices. The agent-based metrics will be listed when you go to Dashboard and click +CREATE DASHBOARD button, next choose one of charts from library and click on Metric dropdown.
Alerting policies:
Alerting Policies can be configured in order to create notification when event and metric threshold are reached. The policies can have one or more condition to trigger the alert and will create an incident that is visible in the cloud Monitoring Console.

Comment
TABLE OF CONTENTS
- Cloud Storage Overview
- Understanding Cloud Firestore & Cloud SQL
- Understanding Cloud Spanner & Bigtable
- LAB Configure GCP Bucket
- LAB GCP Cloud Storage Bucket , Upload Object and enable versioning
- LAB Implement Google Cloud SQL & Test
- LAB Configure Cloud Spanner & test
- LAB Create Lifecycle policies of Bucket
- Networking in GCP
- GCP Load Balancing & NAT
- GCP Hybrid Connectivity
- LAB: Configure Auto Scaling in GCP
- LAB: Configure & Test HTTP(S) Load Balancing
- LAB: Configure a custom VPC in GCP
- LAB: Deploying networks using Terraform
- LAB: Communicate with Internet using Cloud NAT
- LAB: Creating VPC Peering Architecture
- LAB: Introduction to Network Load Balancer
- LAB: Configure Firewalls Priority
- LAB: Encrypting and Decrypting data using Cloud KMS
- LAB: Traffic blacklisting using Cloud Armor
- LAB: Creation of a Cloud HA VPN Connection
RECENT POSTS
- Installing Context-Aware Network Access Control using Cisco ISE Policies
- Designing Network Access Control that is Scalable using Cisco ISE Architecture
- Enterprise Network Access Control and Policy Enforcement using Cisco ISE
- Secure Device Administration and Network Access Using AAA Architecture
- Designing Enterprise-Class Hybrid Cloud Connectivity Using AWS Networking Services
- Exploring Core AWS Networking and Messaging Concepts for Modern Cloud Architectures
- Understanding Key AWS Services for Modern Cloud Architectures
- Building a Strong AWS Foundation with Amazon S3, EC2, and Virtual Private Cloud
- Understanding the ENSDWI Course: Advanced Cisco SD-WAN (Viptela) Concepts
- A Complete Guide to the DCACI-A Course: Mastering Advanced Cisco ACI Concepts


LEAVE A COMMENT
Please login here to comment.