EMAIL SUPPORT
dclessons@dclessons.comLOCATION
USLAB: Introduction to Cloud Monitoring
Task:
- Create a VM Instance
- Install Monitoring agents on Compute Engine
- Create a Monitoring dashboard, Uptime checks, Alerting Policy in Cloud Monitoring
Solution
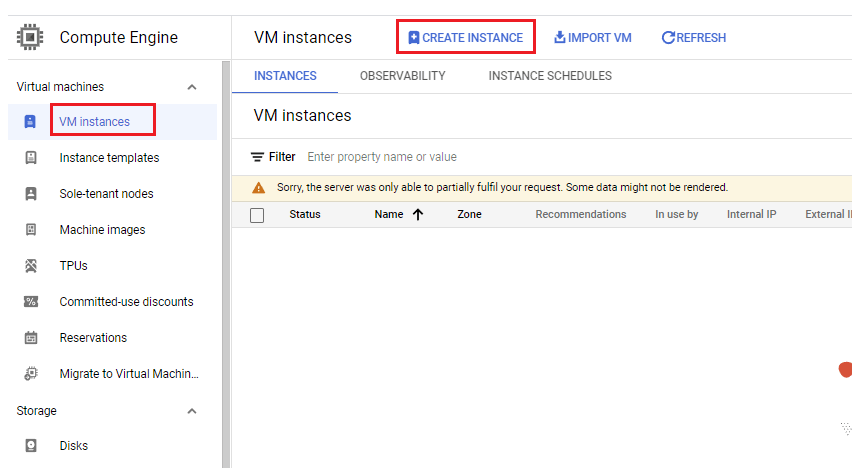
Task 1: Create VM instance
Under Compute Engine | VM Instance: Create Instance
Under Create Instance | Name: dclessons-instance-1 | Region: us-central1(lowa) , Zone: us-central1-a | Machine Configuration: Series : N1 , Machine Type: n1-standard-1
Under Identity & API Access | Service Account: No Service Account
Under Firewall | Enable both Allow HTTP traffic and HTTPS Traffic
Under Advance Option | Under management | Automation: put below commands
#!/bin/bash
apt-get update -y
apt-get install apache2 php php-mysql -y
cd /var/www/html
echo "healthy" > healthy.html
apt-get install wget
apt-get install yum
apt-get install tar
apt-get install sysv-rc-conf
wget https://wordpress.org/wordpress-5.1.1.tar.gz
tar -xzf wordpress-5.1.1.tar.gz
cp -r wordpress/* /var/www/html/
rm -rf wordpress
rm -rf wordpress-5.1.1.tar.gz
chmod -R 755 wp-content
chown -R www-data:www-data wp-content
chown -Rv www-data.www-data /var/www/html/
chmod -R 755 wp-content
rm -rf index.html
systemctl start apache2
Keep all other Option as it is and Click Create
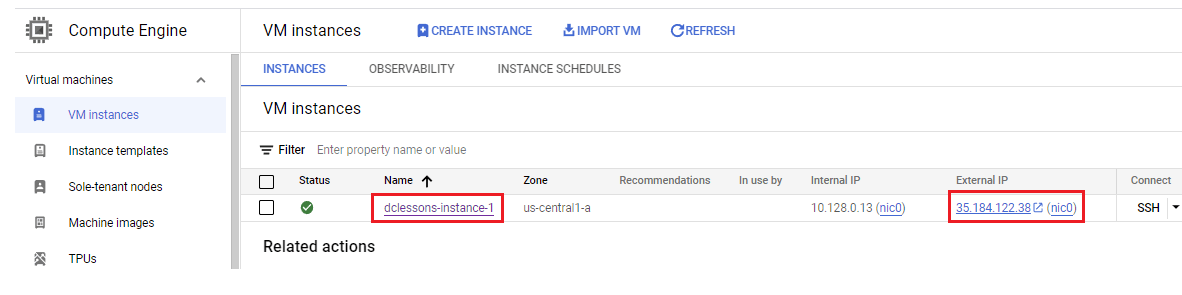
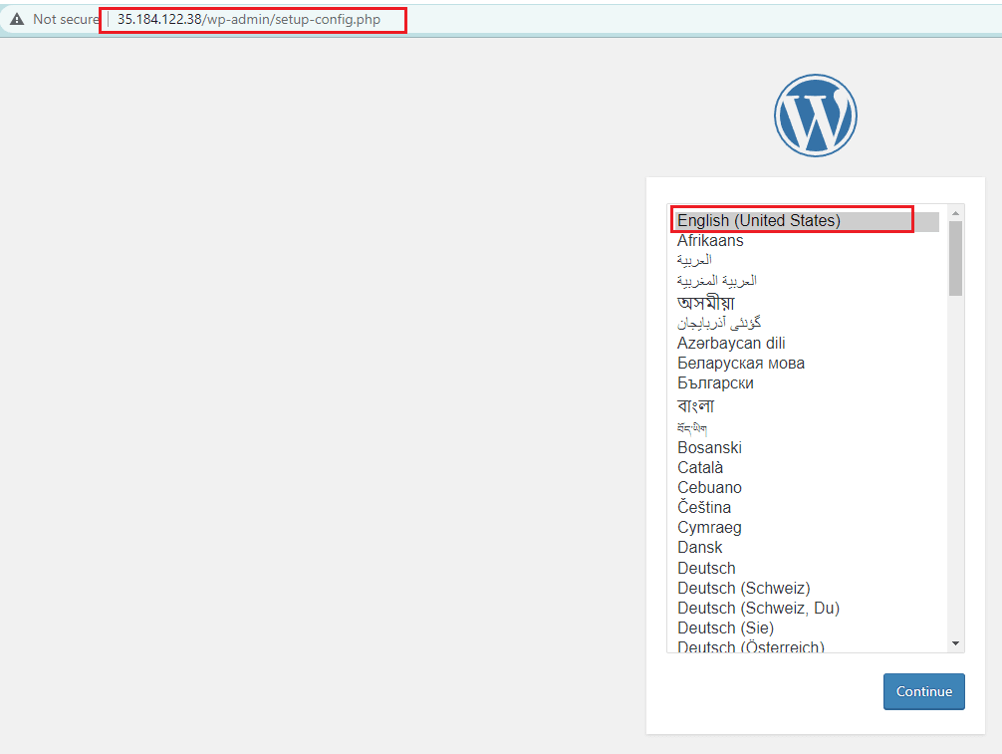
Note the External IP and Browse it on WEB | you will see WordPress
Task 2: Configure Adding Monitoring Agents to instance
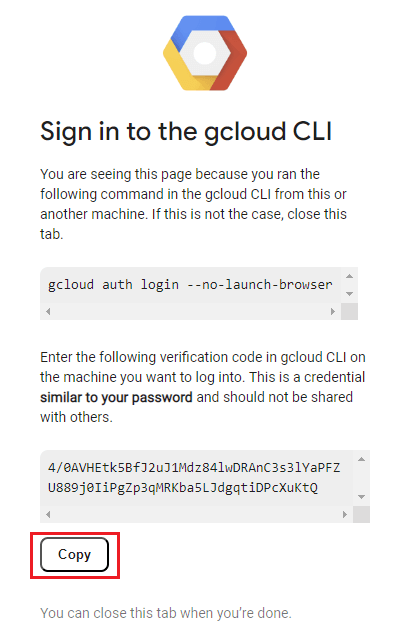
From Console | SSH to Compute Instance | Enter the below command and press Enter | gcloud auth login --no-launch-browser -q
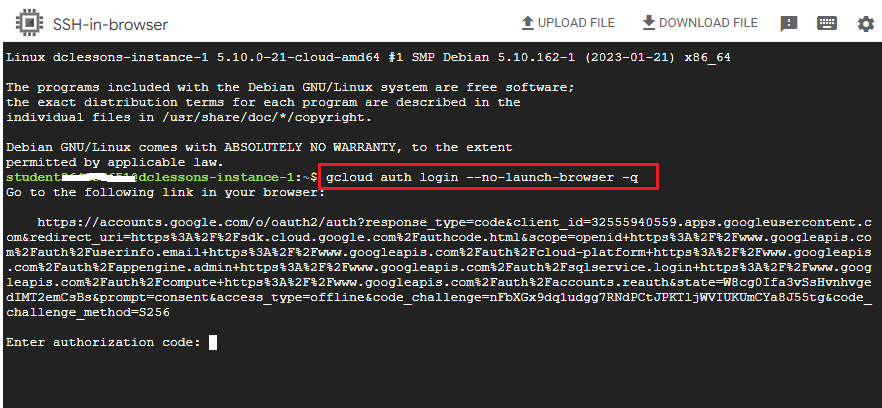
You will receive below as the output. Copy the URL mentioned in the output | Paste the URL in a new tab and login with the Email ID mentioned in the login console. | After the successful login, you will be prompted to give access to Google Cloud SDK, click on Allow.
You will receive an Authorization code as the output, copy the code and switch back to the SSH window.
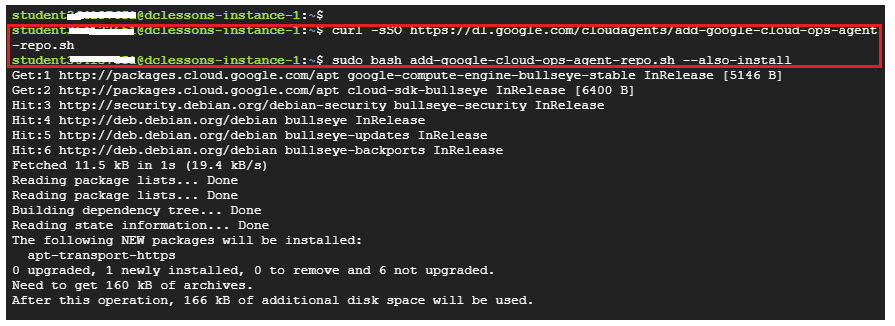
Enter the below command to install the Cloud Monitoring agent.
curl -sSO https://dl.google.com/cloudagents/add-google-cloud-ops-agent-repo.sh
sudo bash add-google-cloud-ops-agent-repo.sh --also-install
When prompted, enter Y to continue.
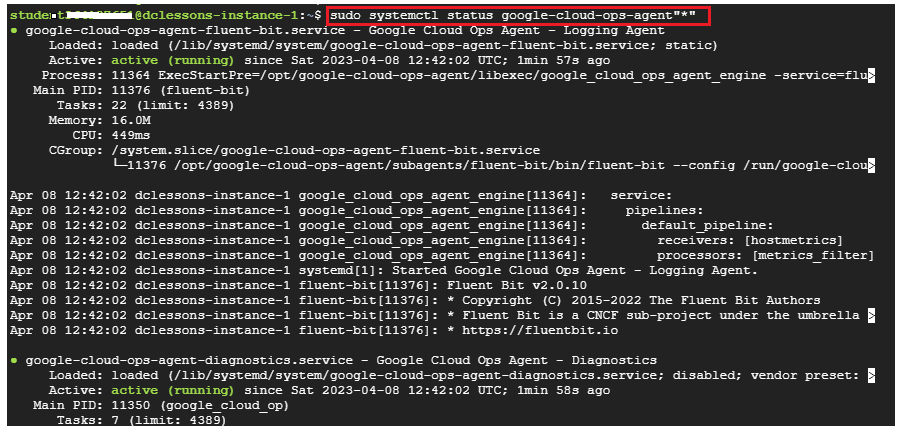
Enter the below command to check the status of the agent and install the updates. Enter :q to exit the command.
sudo systemctl status google-cloud-ops-agent"*"
sudo apt-get update
Task 3: Creating a Monitoring Metrics & Uptime Check:
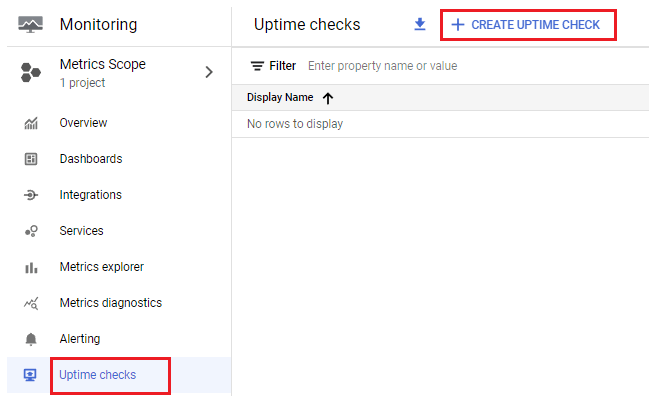
Under Monitoring | Overview | Click Uptime checks
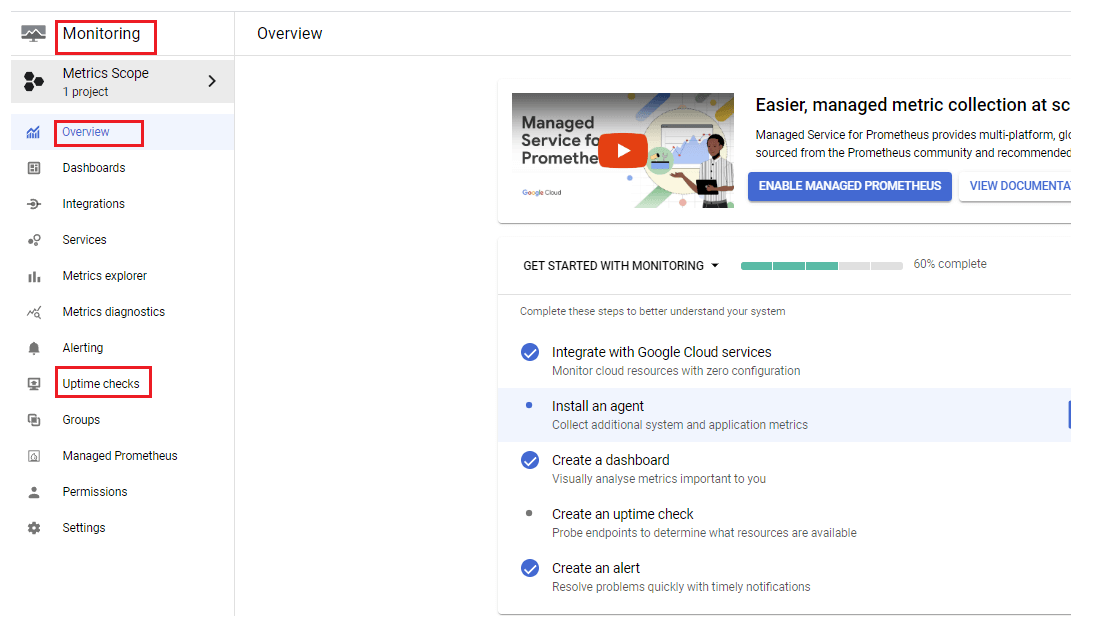
Click Create Uptime check
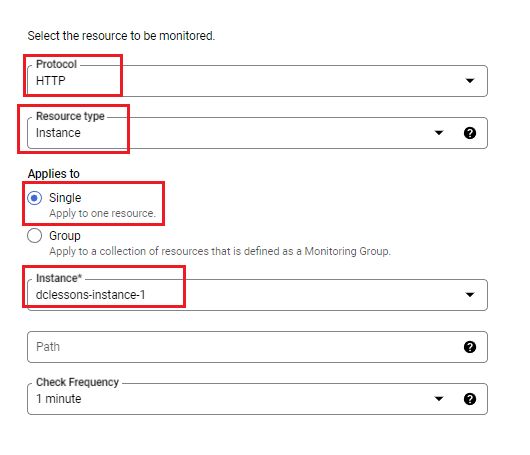
Under Select the resource to be mentioned | Protocol : HTTP | resource Type: Instance | Applies to : Single | Instance: dclessons-instance-1 | Leave other as default an click on Next
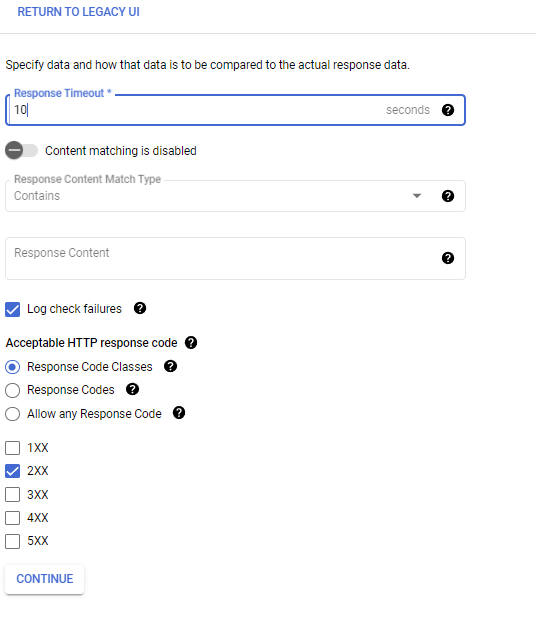
Under response Validation | Leave all setting as default and click on Next | Response Timeout: 10 | Enable : Log Check failures | select other feature as shown | Click Continue
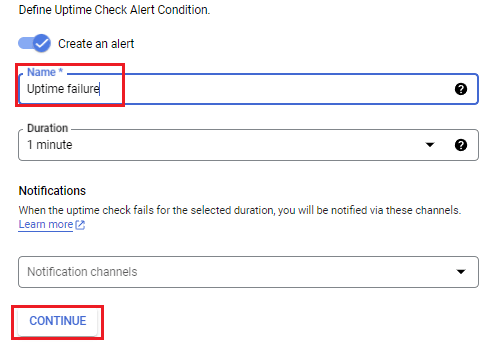
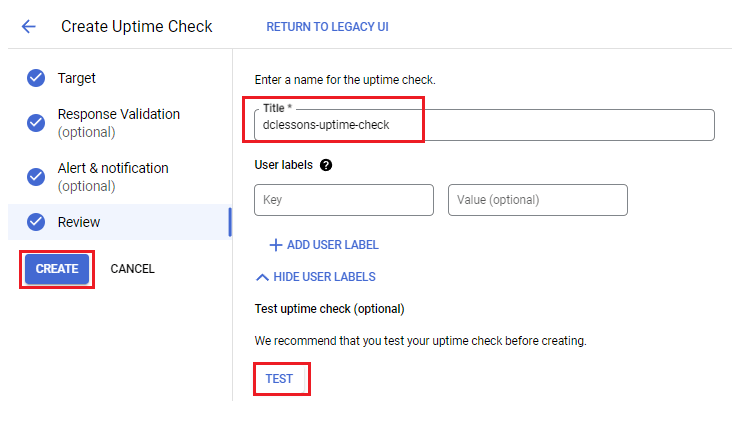
Enable Create an Alert | Name: Uptime failure | Click Continue
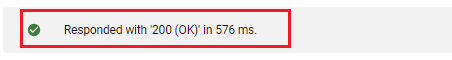
Under Enter a name for Uptime check : dclessons-uptime-check | Click test | After the successful response from testing the connection, click on Create.
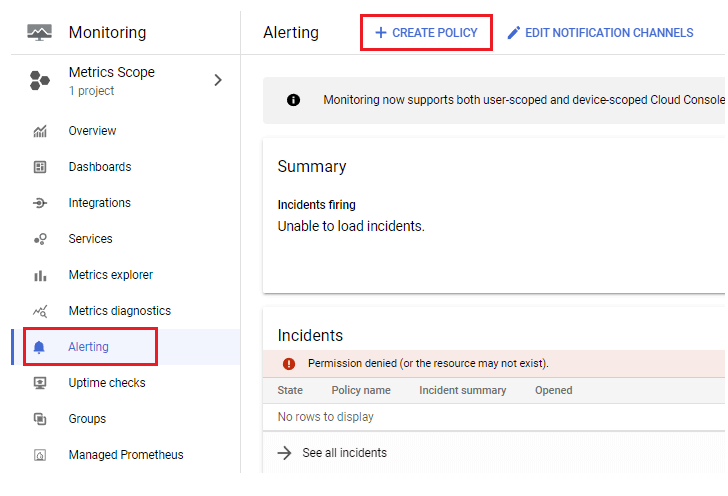
Task 4: Configure Alerting policy
Under Monitoring | Alerting | Create Policy
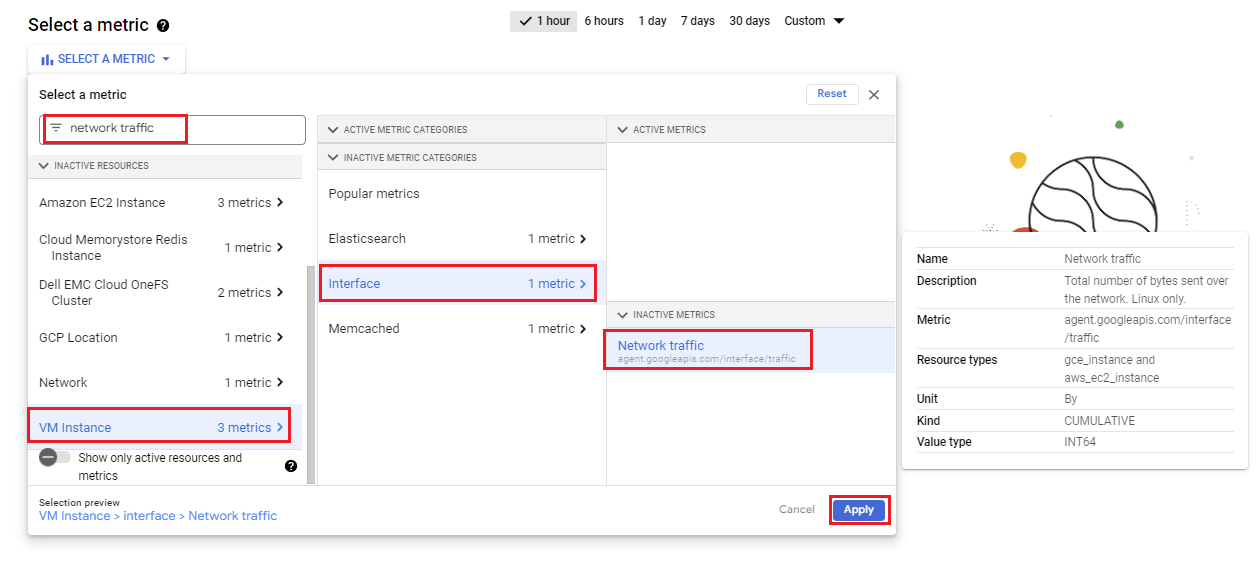
Under Alert Condition |New Condition | Select a metric Click Selecta metric | Disable show only active resources and metrics
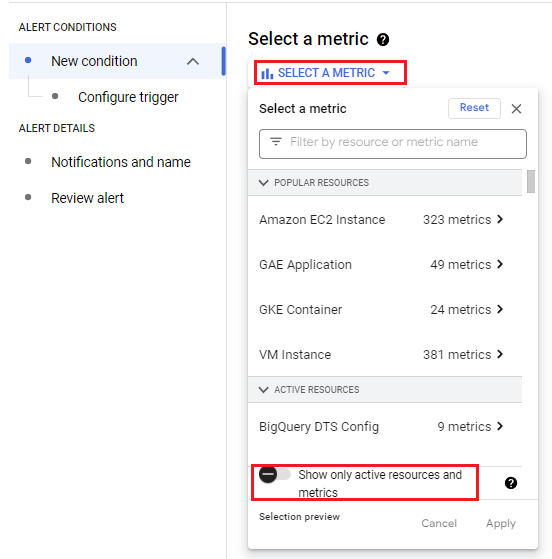
Type Network traffic in the filter by resource and metric name and click on VMinstance and then click on Interface(under Active or Inactive MetricCategories). Select Network traffic (agent.googleapis.com/interface/traffic) (underActive or Inactive Metrics) and click Apply. Leave all other fields at the default value.
Click on Next and Set the Threshold position to Above threshold and the Threshold value to 500. | Advance Option: Condition name: VM Instance-Network Traffic | Next
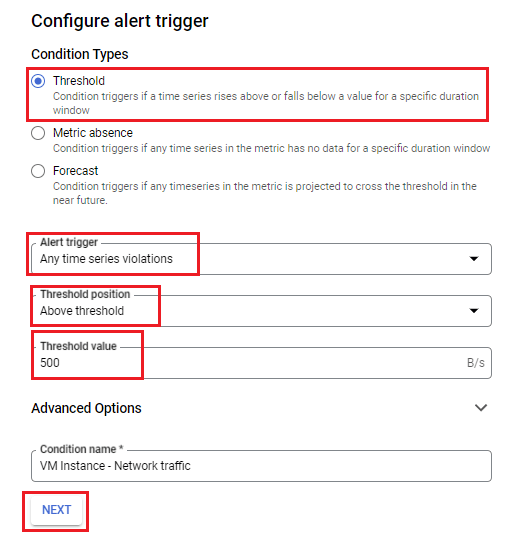
In the Advanced Options section, set the retest window to 1 min. Click on Next.

Comment
TABLE OF CONTENTS
- Cloud Storage Overview
- Understanding Cloud Firestore & Cloud SQL
- Understanding Cloud Spanner & Bigtable
- LAB Configure GCP Bucket
- LAB GCP Cloud Storage Bucket , Upload Object and enable versioning
- LAB Implement Google Cloud SQL & Test
- LAB Configure Cloud Spanner & test
- LAB Create Lifecycle policies of Bucket
- Networking in GCP
- GCP Load Balancing & NAT
- GCP Hybrid Connectivity
- LAB: Configure Auto Scaling in GCP
- LAB: Configure & Test HTTP(S) Load Balancing
- LAB: Configure a custom VPC in GCP
- LAB: Deploying networks using Terraform
- LAB: Communicate with Internet using Cloud NAT
- LAB: Creating VPC Peering Architecture
- LAB: Introduction to Network Load Balancer
- LAB: Configure Firewalls Priority
- LAB: Encrypting and Decrypting data using Cloud KMS
- LAB: Traffic blacklisting using Cloud Armor
- LAB: Creation of a Cloud HA VPN Connection
RECENT POSTS
- Understanding Cisco ISE Authentication and Authorization Policies
- Installing Context-Aware Network Access Control using Cisco ISE Policies
- Designing Network Access Control that is Scalable using Cisco ISE Architecture
- Enterprise Network Access Control and Policy Enforcement using Cisco ISE
- Secure Device Administration and Network Access Using AAA Architecture
- Designing Enterprise-Class Hybrid Cloud Connectivity Using AWS Networking Services
- Exploring Core AWS Networking and Messaging Concepts for Modern Cloud Architectures
- Understanding Key AWS Services for Modern Cloud Architectures
- Building a Strong AWS Foundation with Amazon S3, EC2, and Virtual Private Cloud
- Understanding the ENSDWI Course: Advanced Cisco SD-WAN (Viptela) Concepts


LEAVE A COMMENT
Please login here to comment.