EMAIL SUPPORT
dclessons@dclessons.comLOCATION
USCisco ACI APIC and Built-In Tools
To troubleshoot issues in the Cisco ACI fabric effectively, it’s important to understand the tools available. Knowing what each tool can do and the options they provide will make you more efficient when resolving problems in the ACI environment.
Traditional network tools, along with abstracted monitoring tools in Cisco ACI, help identify whether issues are occurring at the physical or logical layer. For example, you can use ping and traceroute to check connectivity between different Endpoint Groups (EPGs) or from an EPG to an external IP network.
In addition, Cisco ACI offers in-band tools such as iPing and iTraceroute. These provide the added benefit of testing connectivity across all Equal-Cost Multipath (ECMP) routes within the fabric, ensuring that every possible forwarding path is validated.
This combination of traditional, abstracted, and in-band tools gives you a comprehensive approach to isolating and resolving issues in the ACI environment.
Therefore, you can use the following traditional network tools during troubleshooting:
- Ping
- Traceroute
- show commands
- Syslog
- Switch port analyzer (SPAN)
For troubleshooting in Cisco ACI, you can use different tools to verify and analyze configurations. The APIC GUI allows you to check how policies are set up, while the APIC CLI provides commands such as show vlan to display how those configurations are actually deployed. Traditional tools like syslog can be used to send event messages to external systems for monitoring.
You can also configure SPAN in the network to capture packets for external analysis. During troubleshooting, SPAN can be set up to copy only the specific traffic you want to examine, making packet analysis more focused and efficient.
Cisco ACI provides different options and built-in tools that you can use during troubleshooting. Hence, you can use the following abstracted tools:
- Properties (EP/TEP/Contracts)
- Health scores/faults/events/audits
- iPing and iTraceroute
- Atomic counters
- Statistics
- Diagnostics (on-demand)
- SPAN
- ELAM
Cisco APIC GUI provides different operations tools, which can be also used for troubleshooting, such as:
- Visibility and Troubleshooting Wizard
- Capacity Dashboard
- Cisco ACI Optimizer
- Endpoint Tracker
- Visualization (atomic counters)
- Cisco ACI App Center: https://aciappcenter.cisco.com/
The observer in Cisco ACI collects statistics, events, faults, and logs. It is a pre-determined weighting system uses different measures and observations to render a number for the health score. In addition to the global health score, each tenant has its own health score. This feature enables you to determine health scores for a given context. Thus, during troubleshooting you can isolate this information based on specific function (such as state and drops).
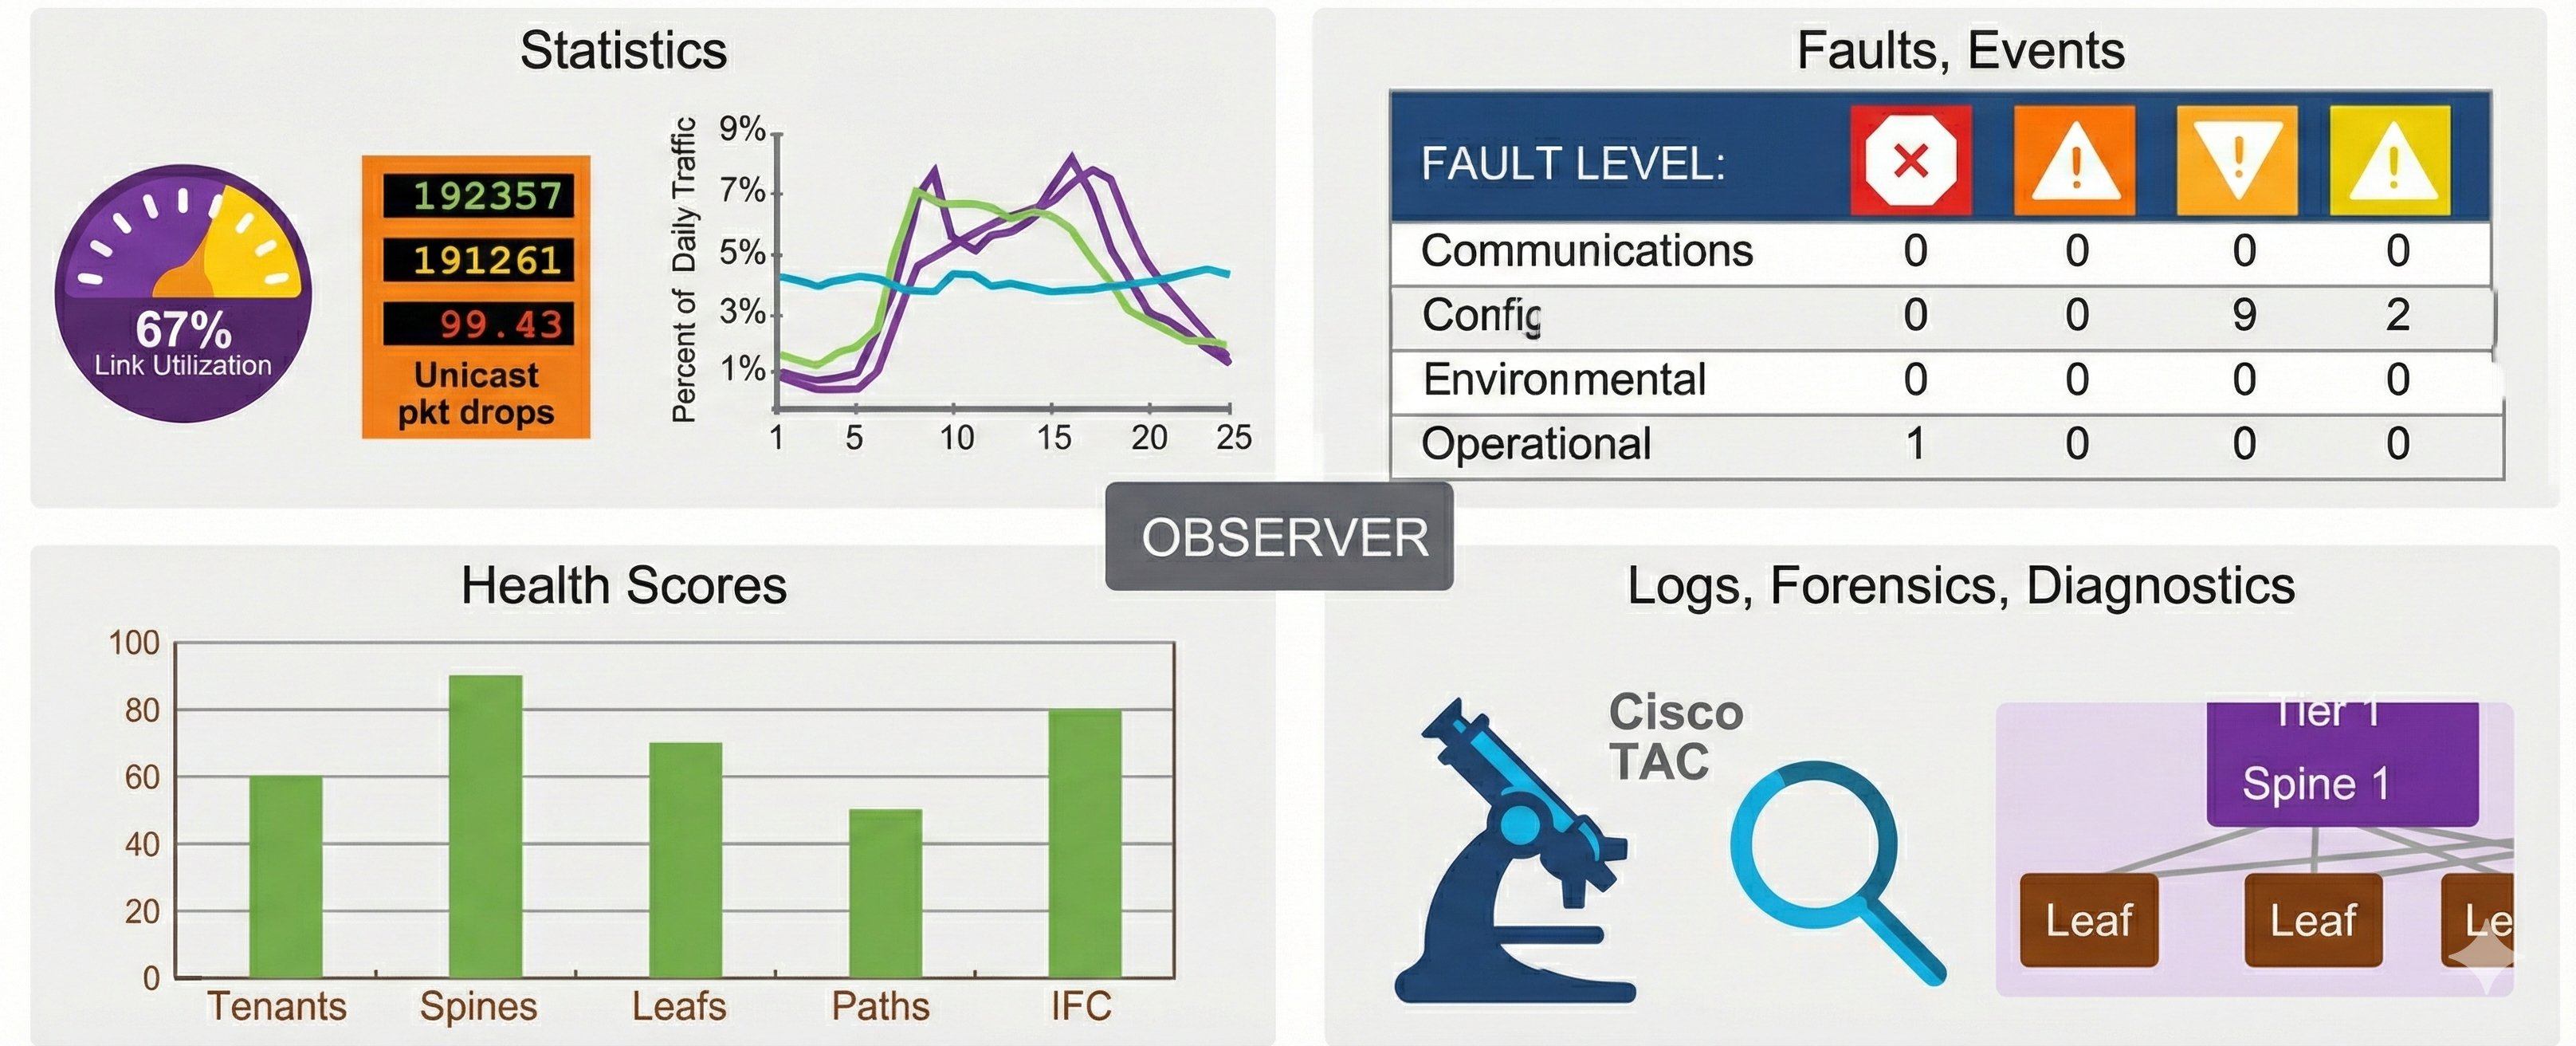
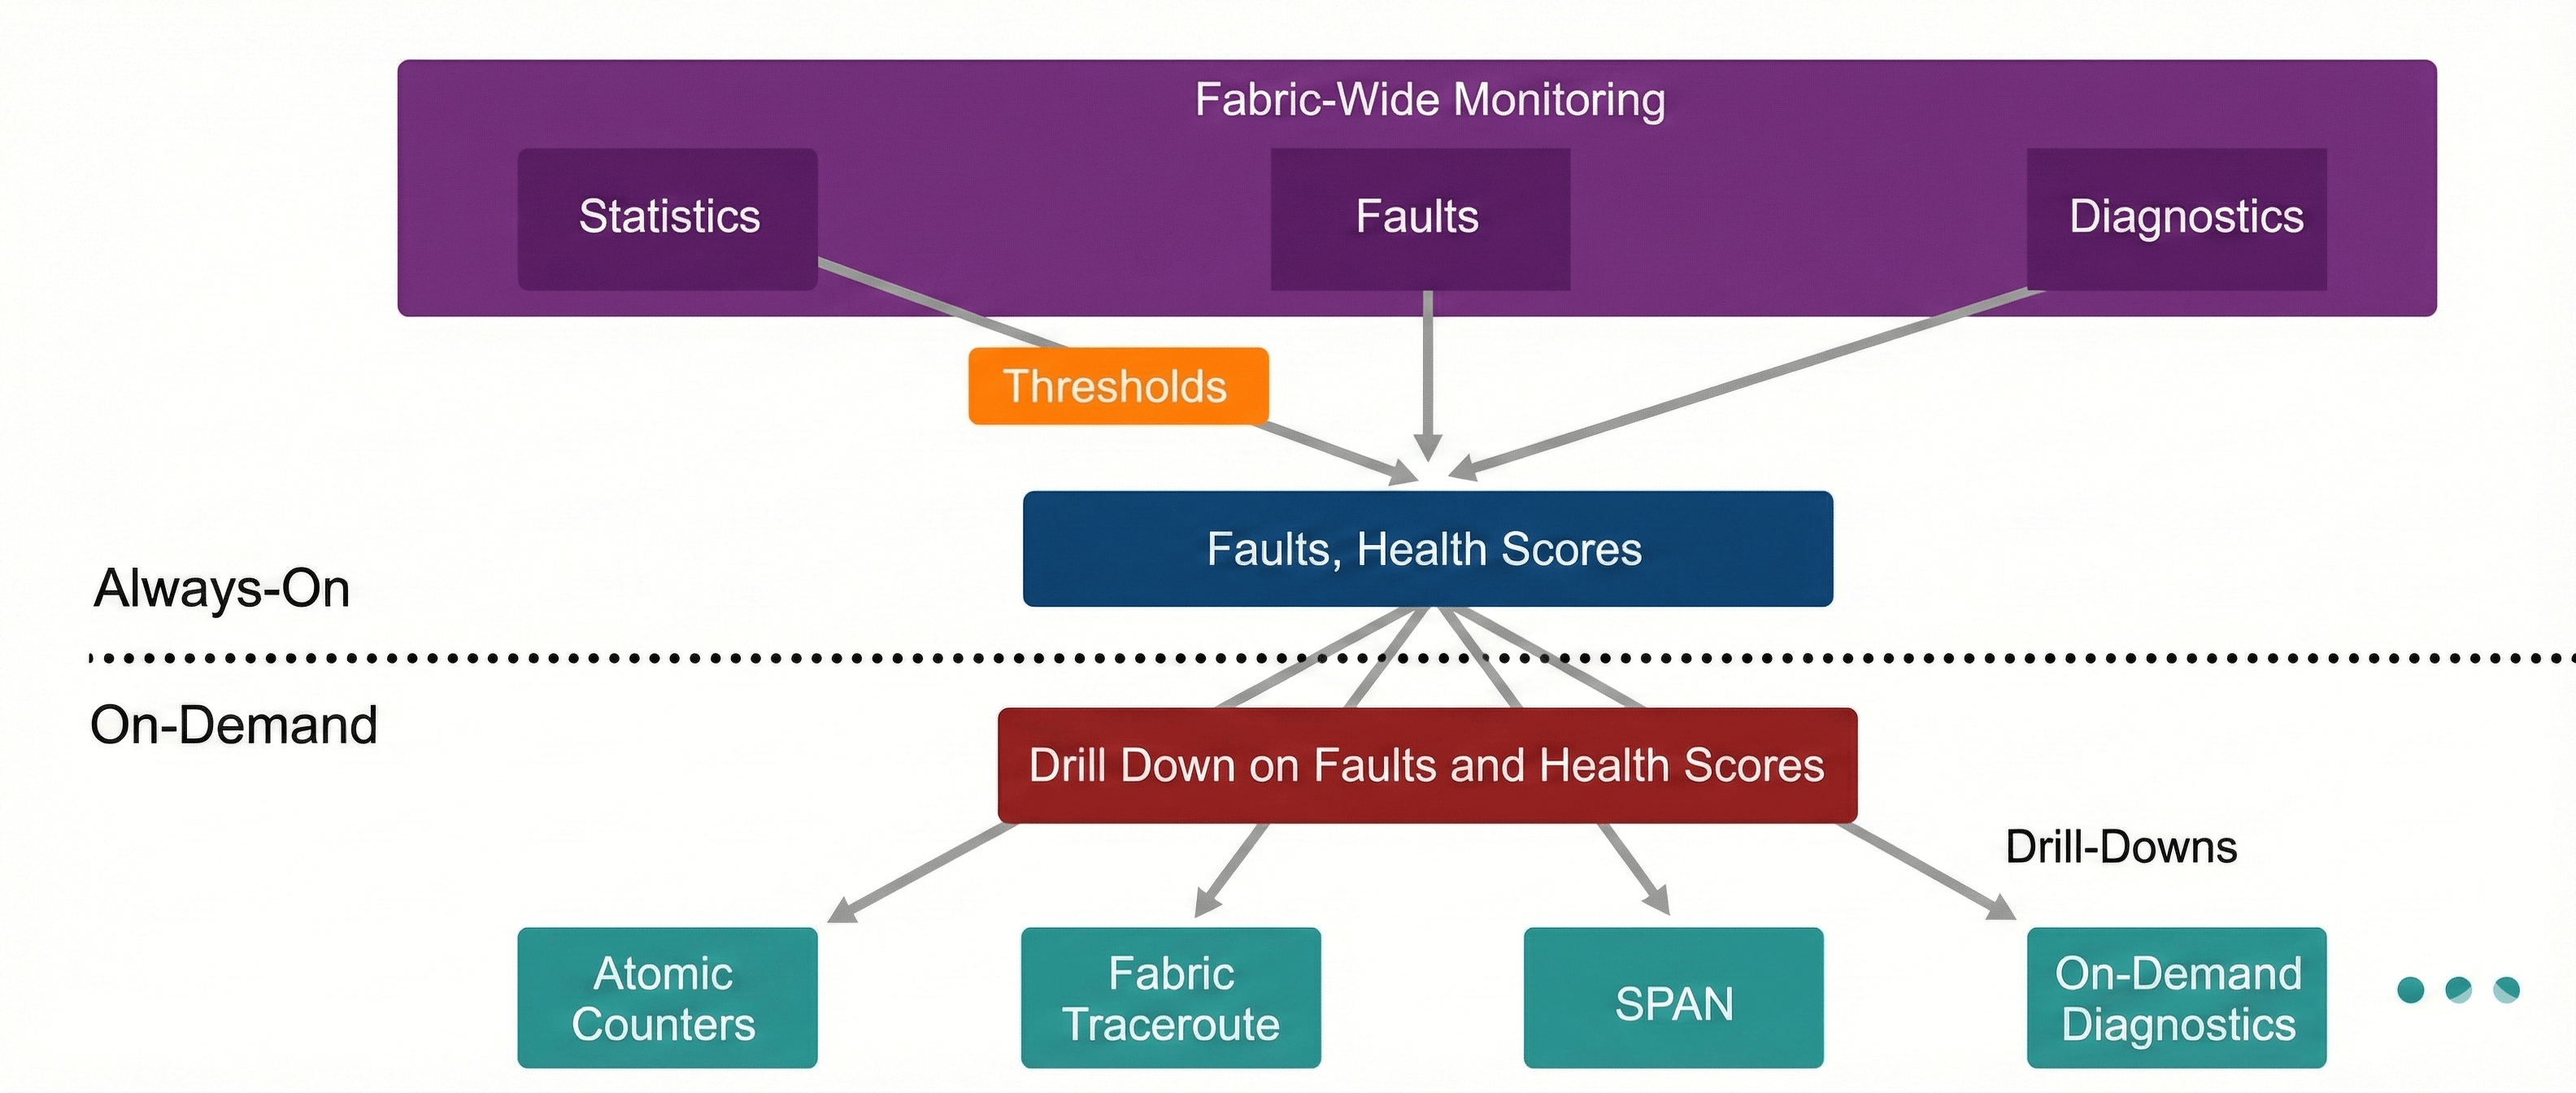
While troubleshooting an issue in Cisco ACI, you can use a top-down approach and combine the fabric monitoring options, including faults, events, and health scores, and ACI built-in tools applicable during troubleshooting, as shown in this figure:
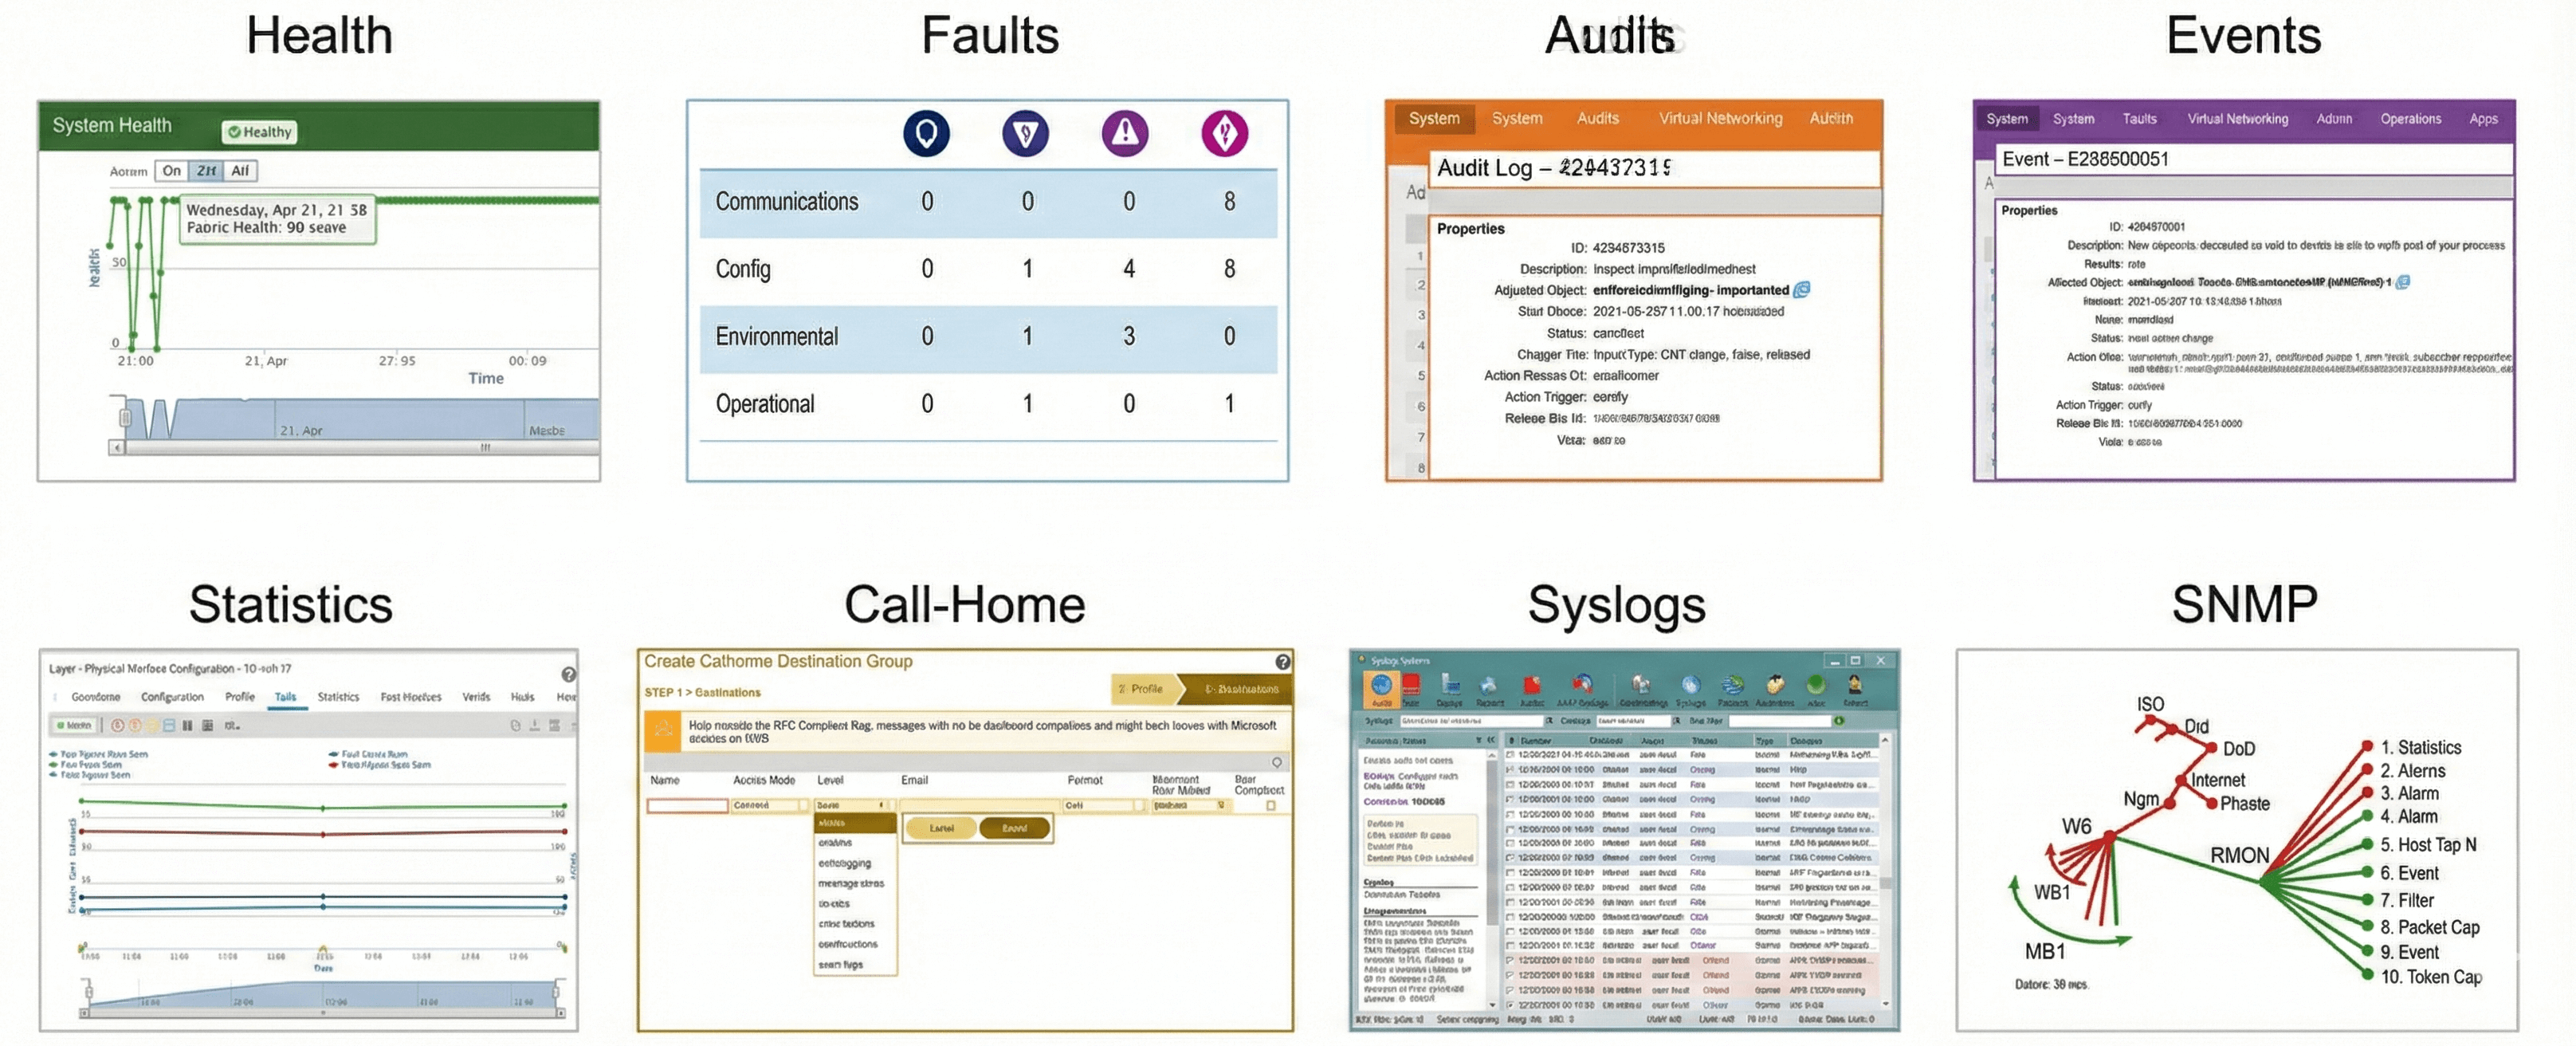
The following figure shows the monitoring tools in Cisco ACI, which can be useful during troubleshooting, such as health scores, faults, audits, events, statistics, and so on.
Using Health Scores for Troubleshooting
Cisco ACI uses a policy model to generate health scores, which provide a quick overview of the condition of different parts of the fabric. These scores can be aggregated at multiple levels, including the system, infrastructure, tenants, applications, and services.
- Health scores range from 0 to 100 (with 100 being perfect).
- Each fault reduces the score based on its severity.
- Scores are propagated to related managed objects (MOs).
- Policies can control penalty values, propagation, and health records.
Health Score Views
- System View: Shows overall system health, including pod scores, tenant scores, fault counts by domain/type, and APIC cluster health.
- Pod View: Aggregates health for a pod (spine and leaf switches) and pod-wide fault counts.
- Tenant View: Displays tenant-specific health, including performance data for applications and EPGs, plus tenant-wide fault counts.
- Managed Object View: Provides health scores for individual MOs and their related dependencies. Administrators can customize these policies.
Health Score Categories
- Each MO belongs to a health score category, which by default matches its MO class name.
- Categories can be changed using policies.
- Example:
- Default category for leaf ports =
eqpt:LeafP - Default category for fabric ports =
eqpt:FabP - With a policy, both can be grouped under a single category called ports.
Each health score category is assigned an impact level. There are five health score impact levels: maximum, high, medium, low, and none. For example, the default impact level of fabric ports is maximum and that the default impact level of leaf ports is high. Certain categories of children MOs can be excluded from the health score calculations of its parent MO by assigning a health score impact of none. Impact levels between objects are user-configurable. However, if an impact level is none by default, the user cannot override it to avoid loops.
The following factors are used for various category impact weights (W), and are not user-configurable:
- Maximum: 100 percent
- High: 80 percent
- Medium: 50 percent
- Low: 20 percent
- None: 0 percent
The health score penalty category represents the overall health score penalties of a set of MOs that belong to a given category and are children or direct relatives of the MO for which the health score is being calculated. The category health score is calculated using the Lp–Norm formula.
Using Faults for Troubleshooting
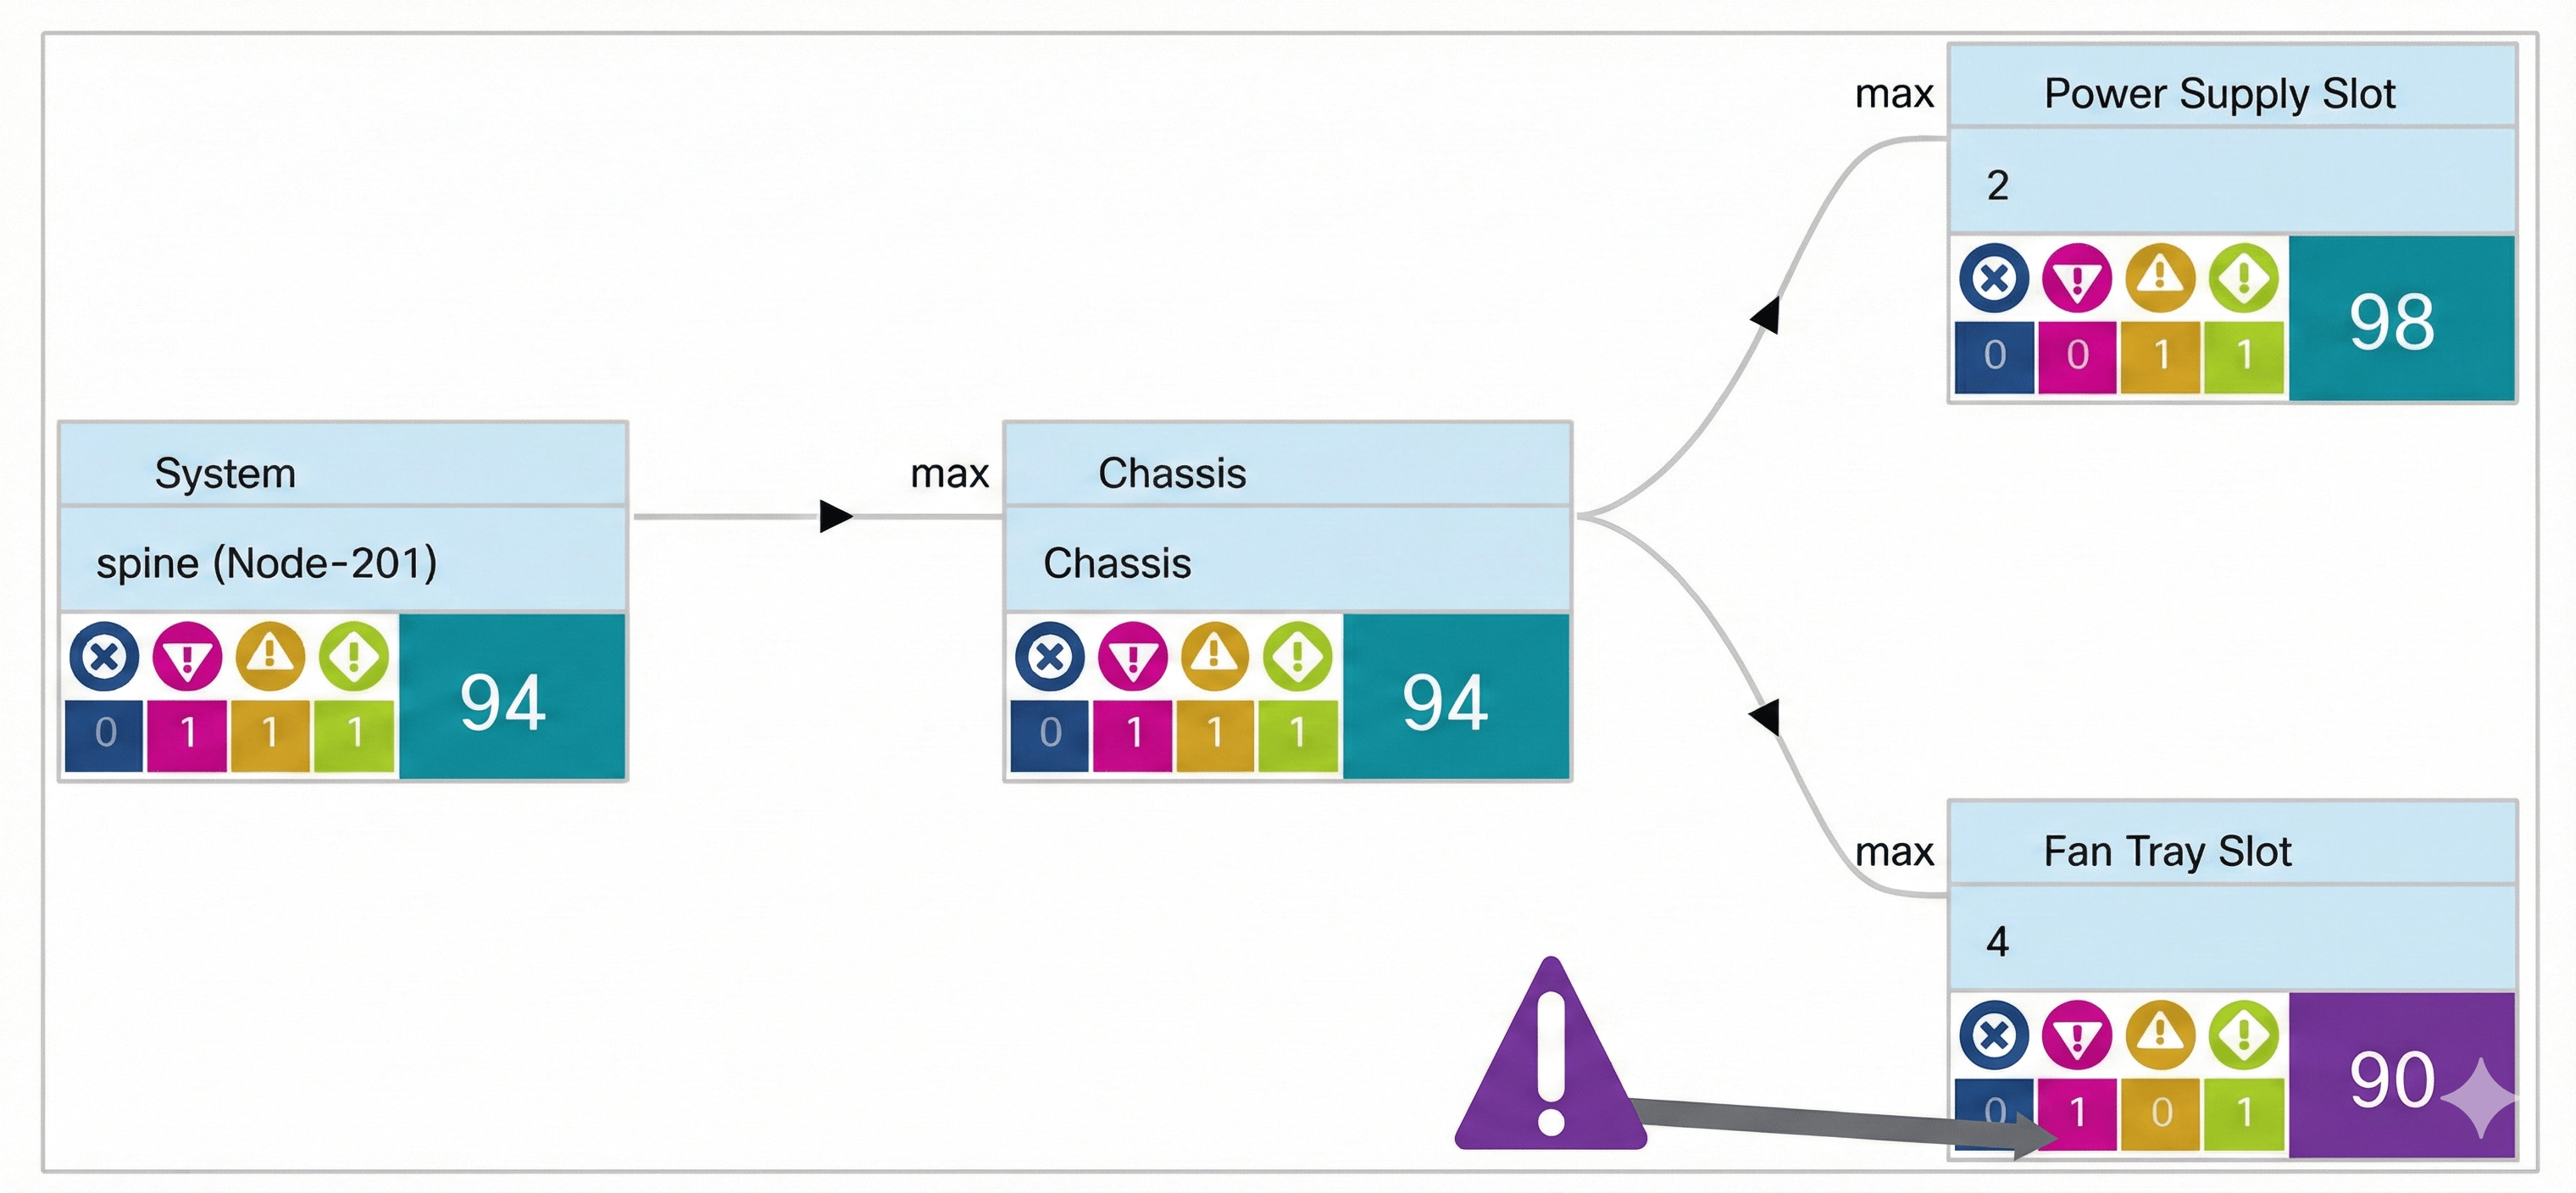
The ACI health scores can facilitate the troubleshooting process, since it provides a quick check-in which a newly occurred issue instantly results in a degradation of the health score. The root cause of the issue can be found by drilling down on health scores to determine where the fault is.
As depicted in the following example from the APIC GUI, you can use the Health tab (available for almost every object and policy) under Fabric > Inventory > Pod_number > Spine_name to drill down and see real-time correlation, as well as fault status for each component on the chosen spine switch.
Fault Managed Objects (MOs) in Cisco ACI
- Fault Creation
- When a condition occurs (e.g., component failure or misconfiguration), the system creates a fault MO.
- The fault MO is a child object of the MO primarily associated with the fault.
- Fault Rules
- Fault conditions are defined by the fault rules of the parent object class.
- Fault MOs appear as regular MOs in the Management Information Tree (MIT).
- They have attributes such as parent, DN (Distinguished Name), RN (Relative Name), etc.
- Fault Classes
- All fault MOs are instances of either:
fault:Instfault:Delegate- Querying Faults
- Fault MOs can be queried by class or DN.
- Queries can include property filters, pagination, and more.
- Faults (along with stats, health, and other special MOs) are not displayed when querying all children of an MO.
- Special queries exist specifically for these special MOs.
Fault Severity Levels
- Severity indicates the impact of the condition on system or component service capability.
- Possible values (from highest to lowest severity):
- Critical → System/component completely unusable
- Major → Significant impact
- Minor → Limited impact
- Warning → Possibly no impact
- Info → Informational only
- Cleared → Fault condition resolved
Usually, a fault MO is automatically created, escalated, de-escalated, and deleted by the system as specific conditions are detected. Only one fault with a given code can exist under an MO. If the same condition is detected multiple times while the corresponding fault MO is active, no additional instances of the fault MO are created. In other words, if the same condition is detected multiple times for the same affected object, only one fault is raised, while the counter for the recurrence of that fault is incremented. The following diagram explains the fault lifecycle.

Comment
TABLE OF CONTENTS
RECENT POSTS
- Installing Context-Aware Network Access Control using Cisco ISE Policies
- Designing Network Access Control that is Scalable using Cisco ISE Architecture
- Enterprise Network Access Control and Policy Enforcement using Cisco ISE
- Secure Device Administration and Network Access Using AAA Architecture
- Designing Enterprise-Class Hybrid Cloud Connectivity Using AWS Networking Services
- Exploring Core AWS Networking and Messaging Concepts for Modern Cloud Architectures
- Understanding Key AWS Services for Modern Cloud Architectures
- Building a Strong AWS Foundation with Amazon S3, EC2, and Virtual Private Cloud
- Understanding the ENSDWI Course: Advanced Cisco SD-WAN (Viptela) Concepts
- A Complete Guide to the DCACI-A Course: Mastering Advanced Cisco ACI Concepts


LEAVE A COMMENT
Please login here to comment.