EMAIL SUPPORT
dclessons@dclessons.comLOCATION
USVeloCloud Feature Overview & Testing
Purpose of this LAB is to understand the NSX SD-WAN VeloCloud Product feature set. To understand this we will be using the NSX SD-WAN Orchestrator. When any user logs in to orchestrator, all branch where Edge are installed and its device status is shown. It also states the number of link that devices is connected and its states.
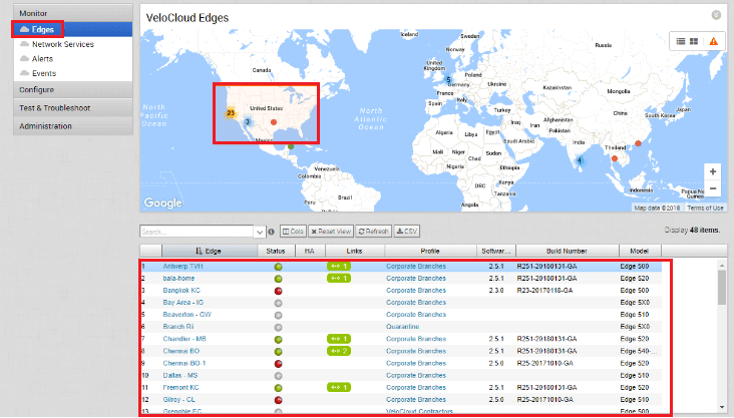
To get a better understanding of where all the edges are located click on the following:
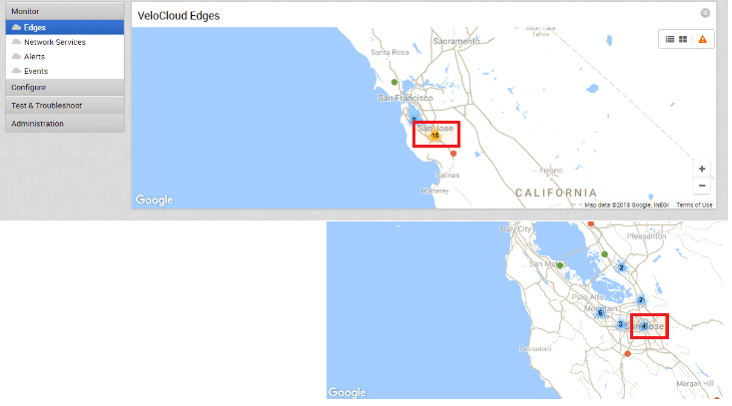
Click on the map and zoom into the US | CA | San Jose
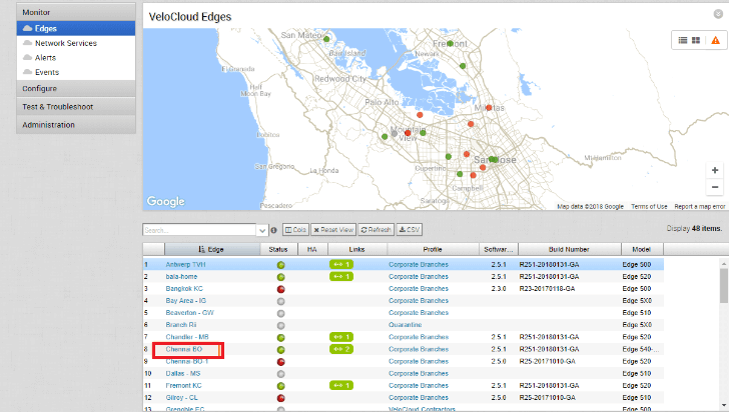
Let’s look at an individual location and see what detail is provided by the SD-WAN solution:
Click to select the ‘Chennai BO’ edge
You will see the Following Window: In this you will see the total number of links, which will be automatically populated, as soon as the Edge is activated. It will discover the Service Provider as well as the bandwidth of the link, including the physical port that this capacity is connected to on the edge device.
Here you can also see the performance of the Link, like its Latency, Jitter, packet loss Behavior. Click on the Link Status detail icon to explore real time link statistics
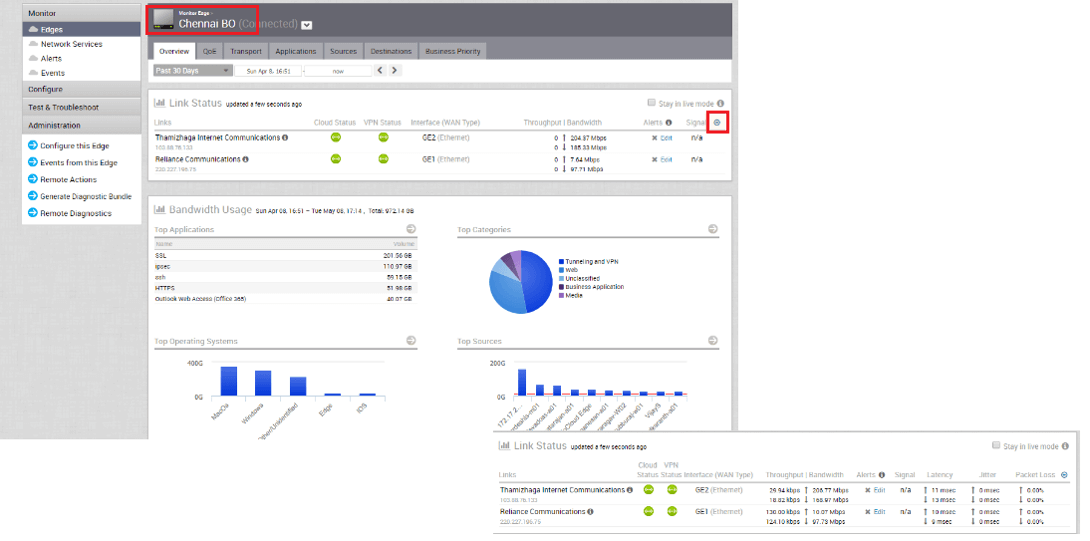
It will help to understand what the links are capable of transporting and what the impact of these conditions are on applications.
Another way to determine the link quality is to look at the Quality of Experience (QoE) rating
- Click on the QoE tab
The screen shows the VeloCloud Quality Sore (VQS) for each of the links and rates them on a scale from 0 through 10 on how well the links perform to carry a certain type of traffic (Voice in the default case).

Comment
TABLE OF CONTENTS
RECENT POSTS
- Installing Context-Aware Network Access Control using Cisco ISE Policies
- Designing Network Access Control that is Scalable using Cisco ISE Architecture
- Enterprise Network Access Control and Policy Enforcement using Cisco ISE
- Secure Device Administration and Network Access Using AAA Architecture
- Designing Enterprise-Class Hybrid Cloud Connectivity Using AWS Networking Services
- Exploring Core AWS Networking and Messaging Concepts for Modern Cloud Architectures
- Understanding Key AWS Services for Modern Cloud Architectures
- Building a Strong AWS Foundation with Amazon S3, EC2, and Virtual Private Cloud
- Understanding the ENSDWI Course: Advanced Cisco SD-WAN (Viptela) Concepts
- A Complete Guide to the DCACI-A Course: Mastering Advanced Cisco ACI Concepts


LEAVE A COMMENT
Please login here to comment.