EMAIL SUPPORT
dclessons@dclessons.comLOCATION
USSD-WAN Dashboard Basic Walk-Through
SD-WAN Dashboard Basic Walk-Through
Task: Login to Cisco Viptela vManage Dashboard and explain some main functions on it.
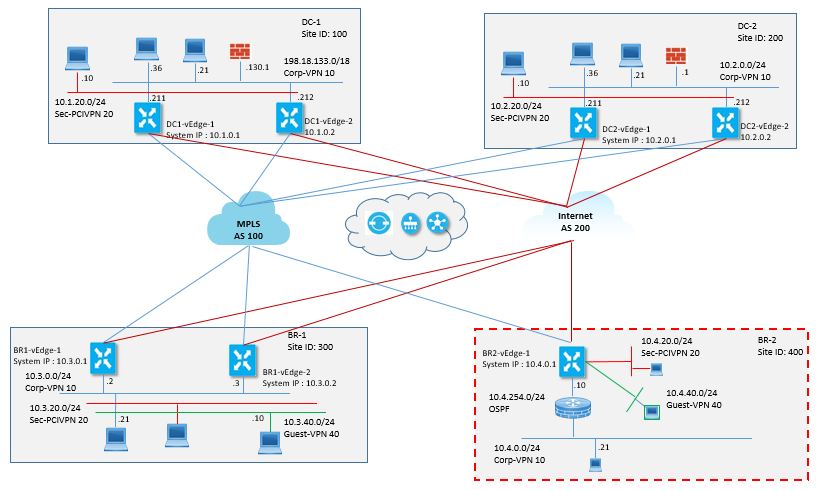
Topology:
Solution:
Launch the vManage GUI using username admin and password admin, once you login a vManage dashboard will be opened which will show the following:
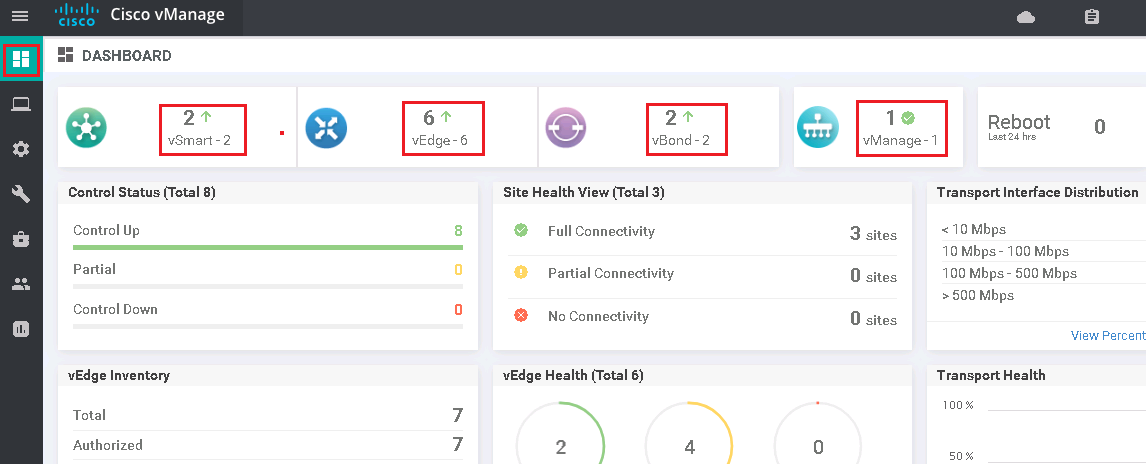
In above figure you will notice that the vManage contains following device learned:
- 2 vSmart Controllers
- 2 vBond Controllers
- 6 vEdge Cloud devices
- 1 vManage Controller
Now on below you will see the following options:
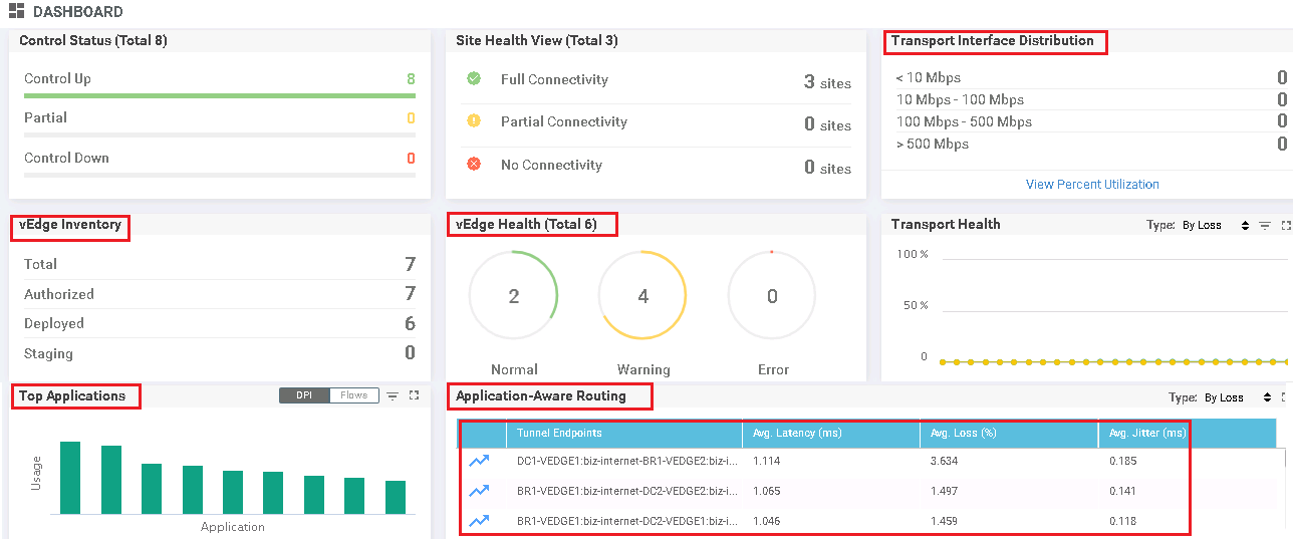
Control Status: It displays OMP running devices status (if the OMP running devices are UP that means 2 vSmart and 6 vEdge)
Site Health View: it tells about the connectivity health between SD-WAN sites.
Transport Interface Distribution: It describes the Link and its speed which we have in overlay network
vEdge Inventory: Displays how many total vEdge devices in vManage are licensed for and how many are deployed
vEdge Health: vManage Monitors device health of all vEdge devices in each site
Transport Health: Monitors if underlay transports are up and running
Top Applications: Displays the Top Applications in terms of usage of the SD-WAN fabric
Application Aware Routing: Displays top applications in terms of usage of SD-WAN fabric.
This lab section will help you to prepare for 300-415 ENSDWI training labs which are required to clear 300-415 ENSDWI exam lab exbhits.
Comment
-
RO
This is a high-quality course on the sd wan dashboard. It will help you give a walk-through of the entire dashboard setup in a very simple step-by-step guide. It has helped me gain a lot about the course.
-
AL
I have learned a lot about the usage of SD-WAN fabric from the course. It has given me the courage to talk confidently in front of my senior executive. I would highly recommend this course to anyone.
TABLE OF CONTENTS
- Onboarding & Provisioning Configuring Templates
- Authentication between vSmart & vBond
- Authentication between vSmart Controller
- Authentication between vBond & vEdge Router
- Authentication between vEdge Router & vManage NMS
- Authentication between vSmart Controller & vEdge Router
- Viptela Specific Port Terminology
- Configure vManage & Generate Certificate
- Configure vBond & Generate Certificate
- Configure vSmart & Generate Certificate
- Configure vEdge & Generate Certificate
- Secure DataPlane Bringup
- Control Plane & Data Plane Operation - Unicast Routing Overview
- Configuring OMP & Its attributes
- Configure Unicast Overlay Routing
- Routing Configuration Example
- Segmentation Overview
- Configuring Segmentation
- Segmentation Configuration Example
- Data Traffic across Private WANs
- NAT in SDWAN & Data Encryption
- SD-WAN Viptela Policy Overview
- SD-WAN Centralized & Localized Control Policy Overview
- SD-WAN Centralized & Localized Data Policy
- Application – Aware Routing Overview
- Service Chaining
- Traffic Flow Monitoring
- vEdge Router as NAT Device
- Zone Based Firewalls
- Configuring Application Aware Routing
- Configure Centralized Control Policy
- Configuring Centralized Data Policy
- Configuring Cflowd Traffic Monitoring
- Configuring Zone based Firewall
- Service Chaining Configuration Example
- Configuring Service Side NAT
- Configuring Transport side NAT
RECENT POSTS
- What is Docker and Why is It Important?
- Learn Python 3.0 Programming for Network Automation
- Cisco ACI Data Centre: A Comprehensive Overview
- How to Prepare for the Microsoft Azure AZ-305 Exam
- AWS Training Certification Course for Solutions Architect
- Cisco SASE Architecture
- SASE vs SD-WAN
- What is SASE
- Accessing Amazon S3 using AWS private Link in Secure hybrid method.
- Cisco Smart Licensing Policy


LEAVE A COMMENT
Please login here to comment.